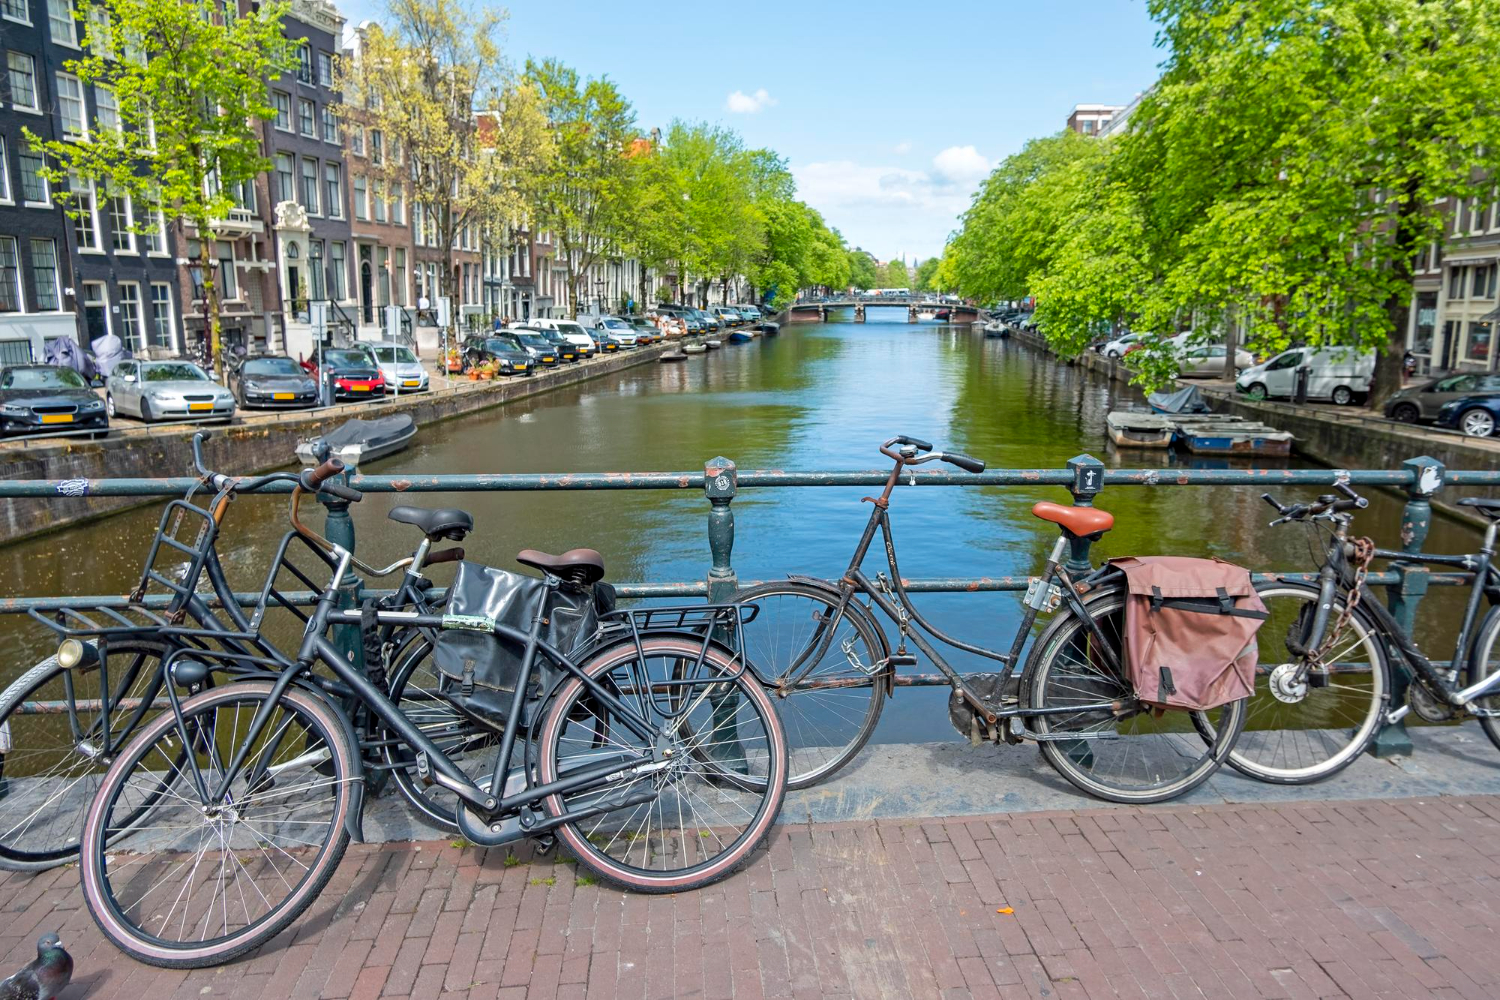
The Netherlands has approximately 23 million bicycles for 17.6 million people. The Dutch ride bikes for approximately 27% of all trips. Children cycle to school starting at age 4-5. Adults cycle to work in business clothes. Elderly people cycle for daily errands. The cultural pattern looks effortless from outside but resulted from specific policy decisions made starting in the 1970s in response to specific crises. Understanding what the Dutch actually did reveals why other countries have substantially failed to replicate their success.
The Dutch cycling phenomenon — over 23 million bicycles for 17.6 million people, more bikes than residents — is often presented as a cultural inheritance or natural Dutch inclination. The reality is more interesting and substantially more replicable than the cultural-explanation narrative suggests. The current Dutch cycling infrastructure resulted from specific policy decisions made starting in the 1970s, in response to specific crises that produced political will for substantial infrastructure investment. Understanding the actual history reveals why cycling-friendly infrastructure is achievable elsewhere — and why it’s substantially harder than just deciding to copy what the Dutch built.
The Pre-1970s Reality
Most people don’t realize that the Netherlands wasn’t always a cycling paradise. Through the 1950s and 1960s, the Netherlands was rapidly motorizing along similar patterns to other Western European countries. Cars were taking over Dutch cities. Bicycle use was declining. Streets were being widened. Parking was being prioritized. Traditional Dutch cycling culture was being substantially abandoned in favor of automobile-centric urban planning. The trajectory of the 1960s suggested the Netherlands was heading toward an automobile-dominated future similar to American patterns. Specific decisions made in the 1970s reversed this trajectory.
The “Stop de Kindermoord” Movement (1973)
Two specific events catalyzed Dutch policy change. First: in 1971 alone, more than 3,300 people were killed in Dutch traffic accidents — including over 400 children. The disproportionate child death toll produced specific public response. The “Stop de Kindermoord” (Stop the Child Murder) movement emerged in 1973, demanding that Dutch government prioritize child safety over automobile convenience. The movement organized protests, blocked streets, and produced sustained political pressure. The substantial public response to children’s deaths created political will for infrastructure changes that affected automobile users — changes that would have been politically impossible in a less concentrated context.
The 1973 Oil Crisis

The second catalyzing event was the 1973 oil crisis. OPEC’s oil embargo following the Yom Kippur War produced substantial fuel shortages across Western Europe and North America. The Netherlands was among the countries most affected, with specific “Car-Free Sundays” implemented to conserve fuel. The Dutch experienced specifically what cities looked like without cars dominating streets — children playing in streets, communities reconnecting in public spaces, dramatic reduction in noise and pollution. The visible alternative produced substantial political pressure to maintain some elements of car-free infrastructure permanently. The combination of child safety concerns and energy crisis effects produced the political will for major changes.
The Specific Policy Decisions
Beginning in the mid-1970s, the Dutch government made specific decisions that other countries didn’t make. Streets were redesigned to prioritize bicycle infrastructure rather than automobile capacity. Speed limits were reduced in residential areas to genuinely safe levels (often 30 km/h or 20 mph). Separated bicycle lanes — physically separated from automobile traffic, not just painted lines — were systematically built. Traffic signals were programmed to prioritize bicycles and pedestrians. Bicycle parking infrastructure was built at substantial scale. Tax policies encouraged bicycle use over automobile use. School design changed to support cycling rather than parental car drop-off. The cumulative effect of these specific decisions, sustained over decades, produced the modern Dutch cycling environment.
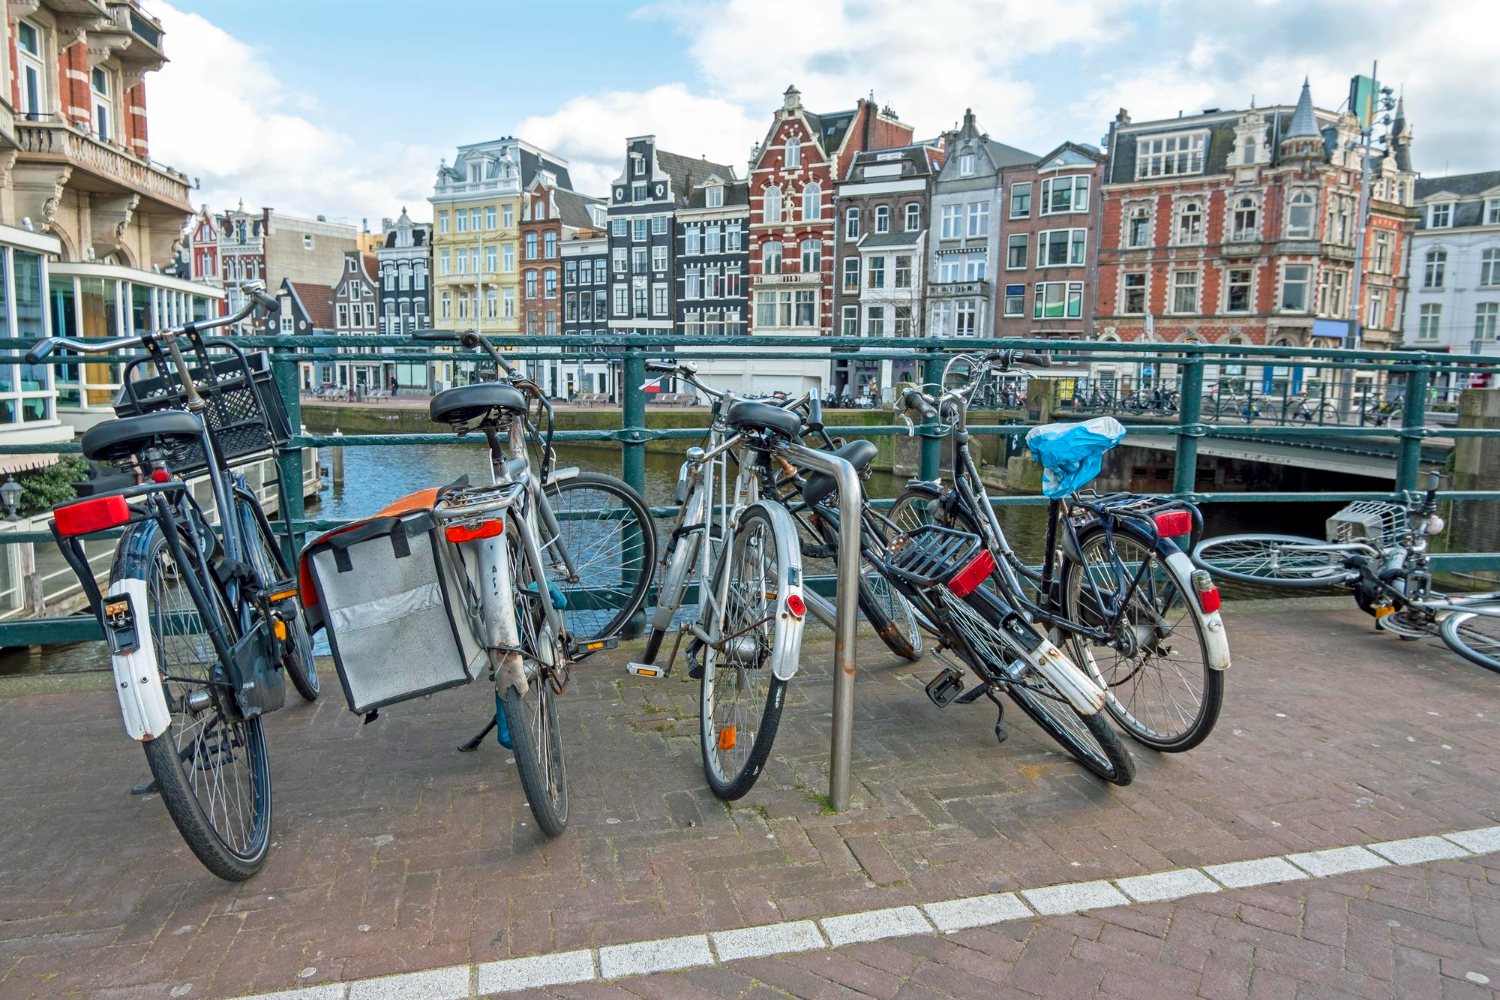
The Infrastructure Specifically
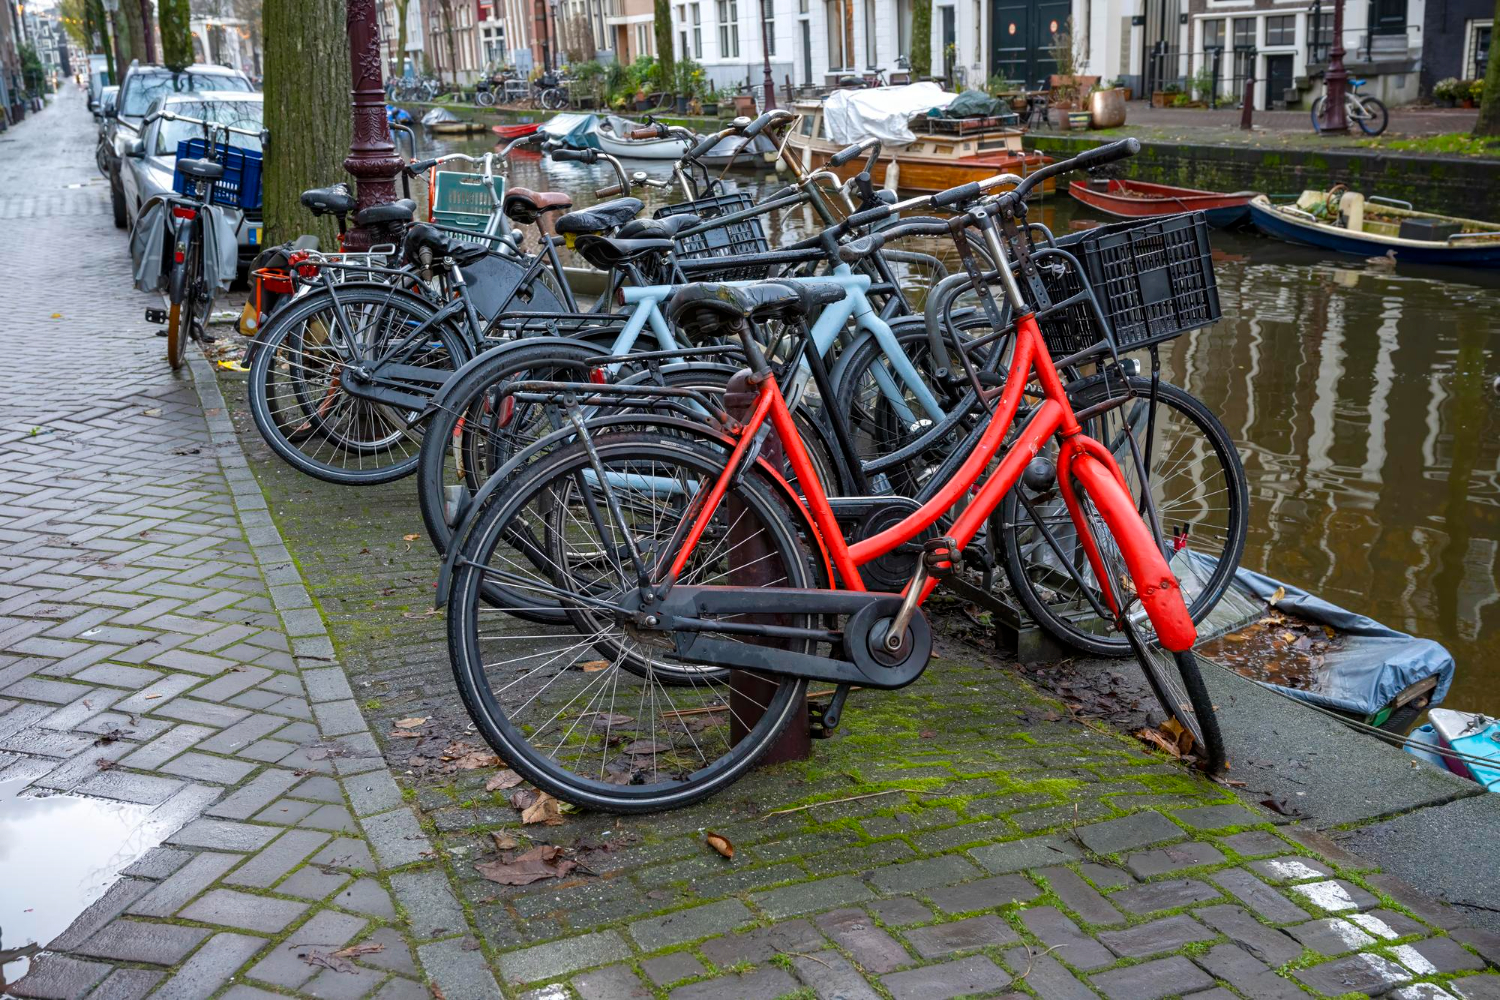
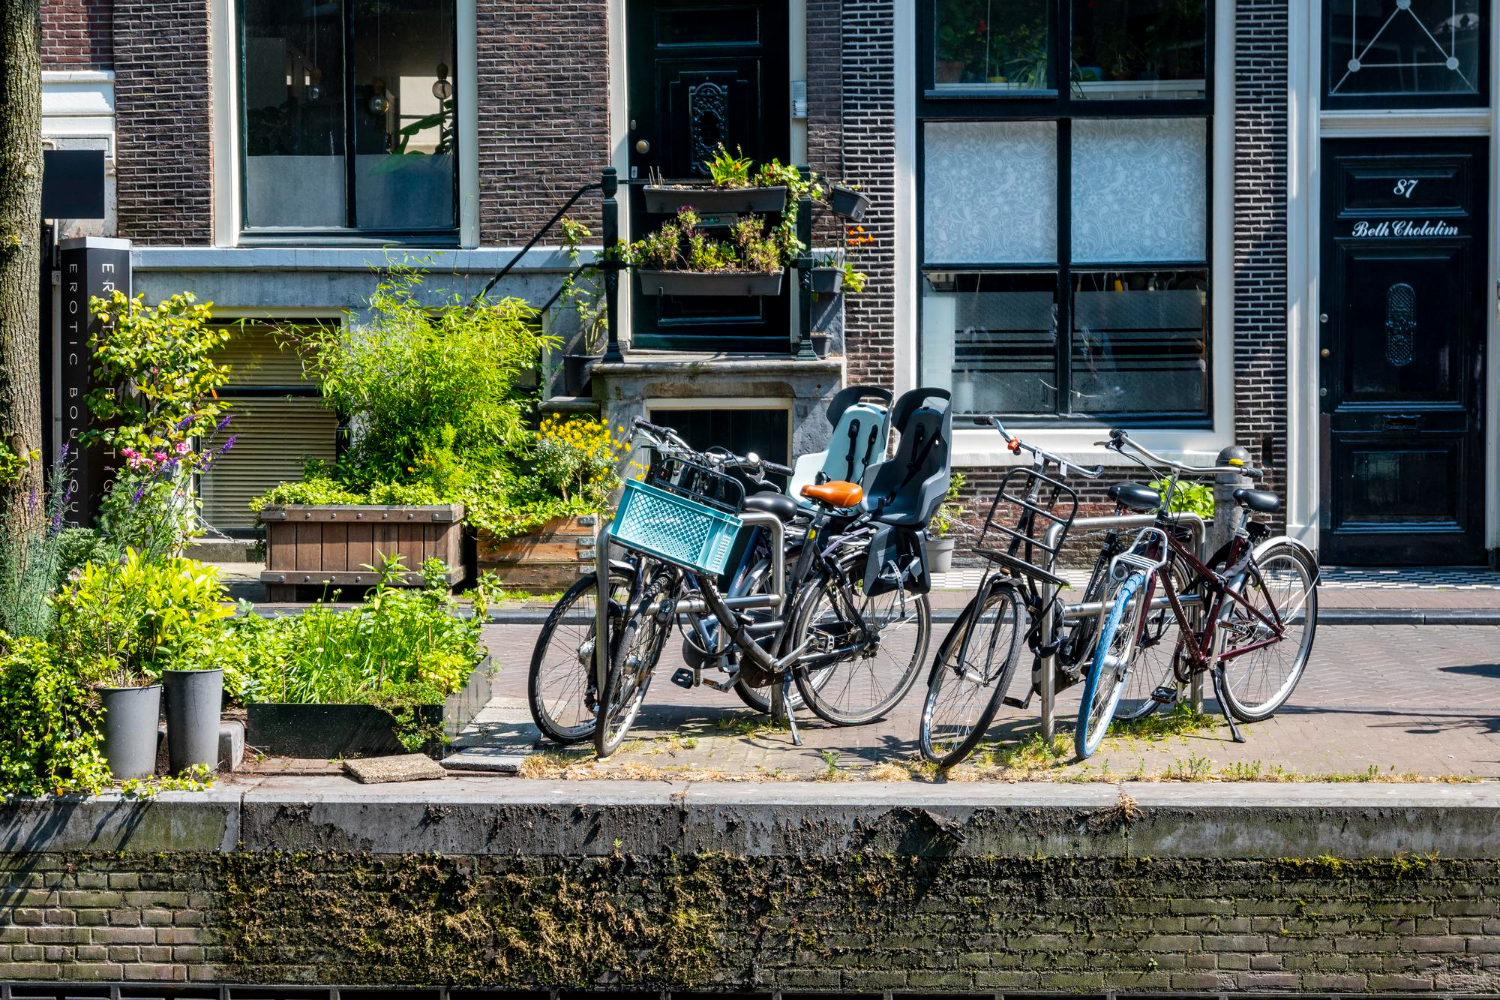
Modern Dutch cycling infrastructure has specific characteristics that differentiate it from typical bike lanes elsewhere. Physical separation from automobile traffic — not just painted lines but separate paths with curbs or buffers. Continuous network coverage — you can cycle to essentially any destination through dedicated infrastructure. Specific intersection design that prioritizes cyclist safety and convenience. Dedicated traffic signals for cyclists at major intersections. Bicycle highways (snelfietsroutes) connecting cities for longer commutes. Substantial bicycle parking at all major destinations including train stations (Utrecht’s central station has 12,500 bicycle parking spaces). Bicycle-specific traffic counting and route optimization. The cumulative infrastructure represents tens of billions of euros in cumulative investment over 50+ years.
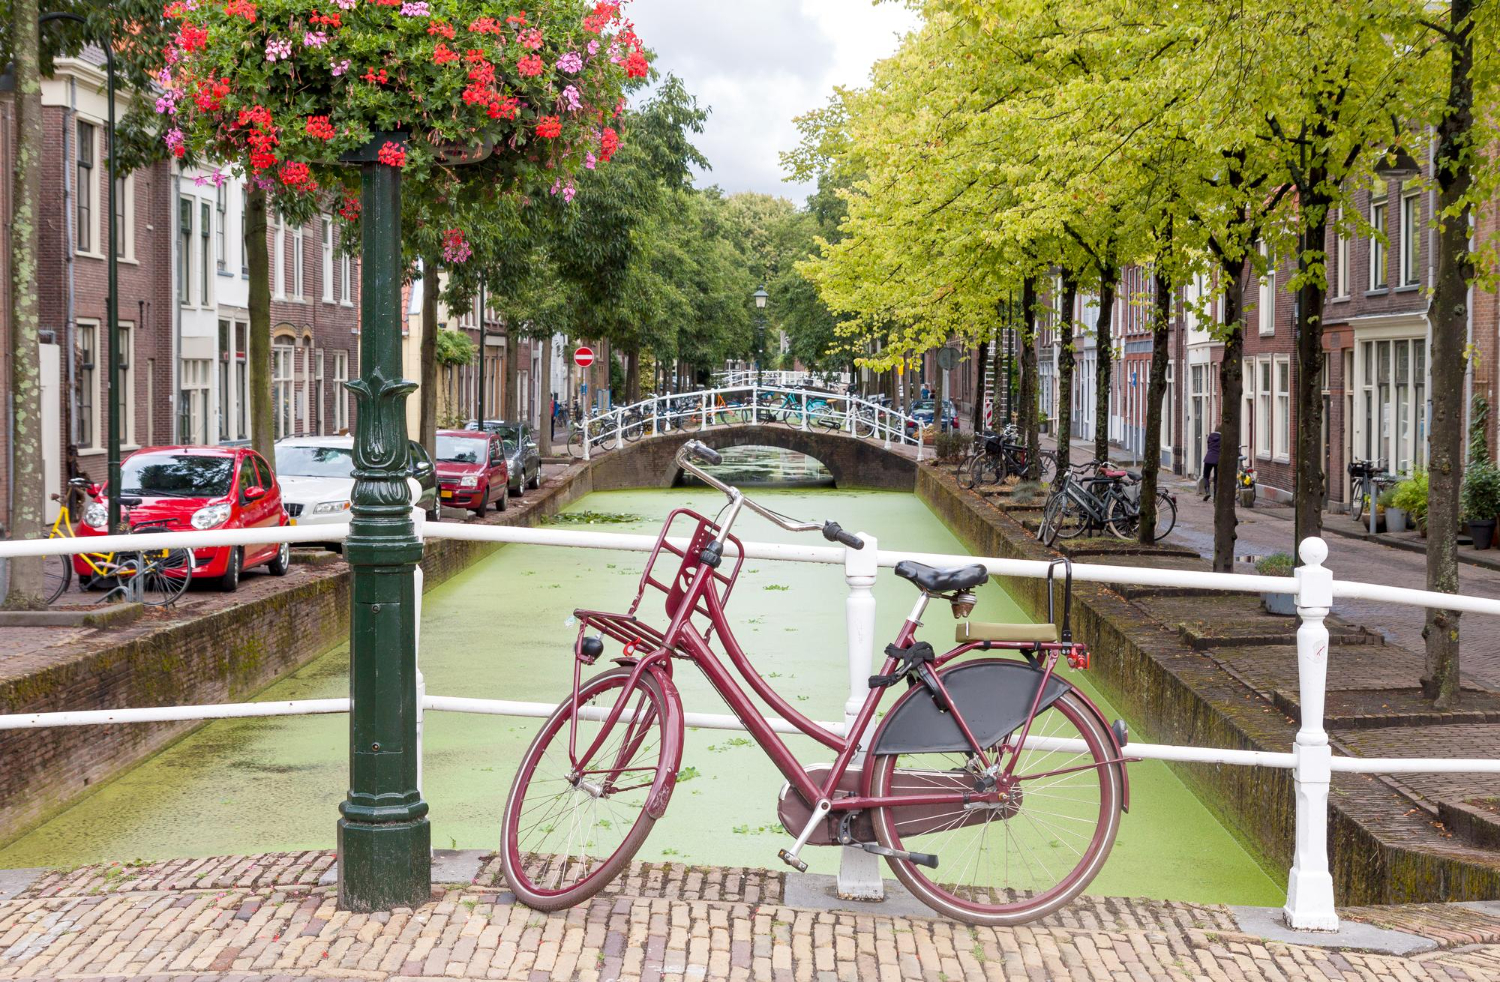
How Dutch Cycling Actually Works
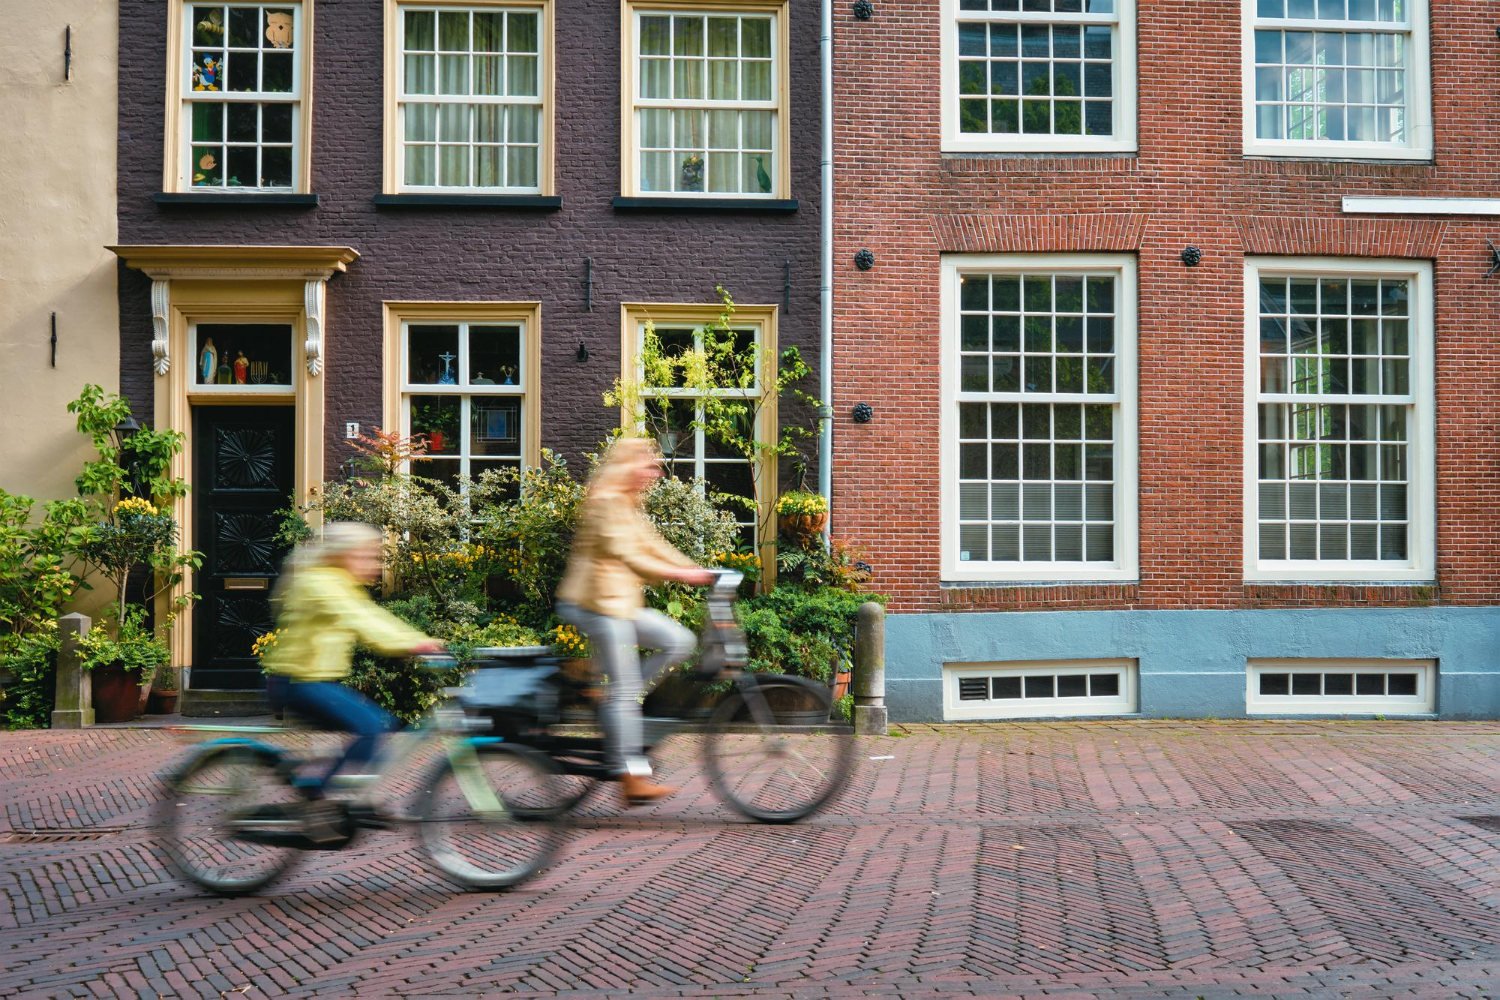
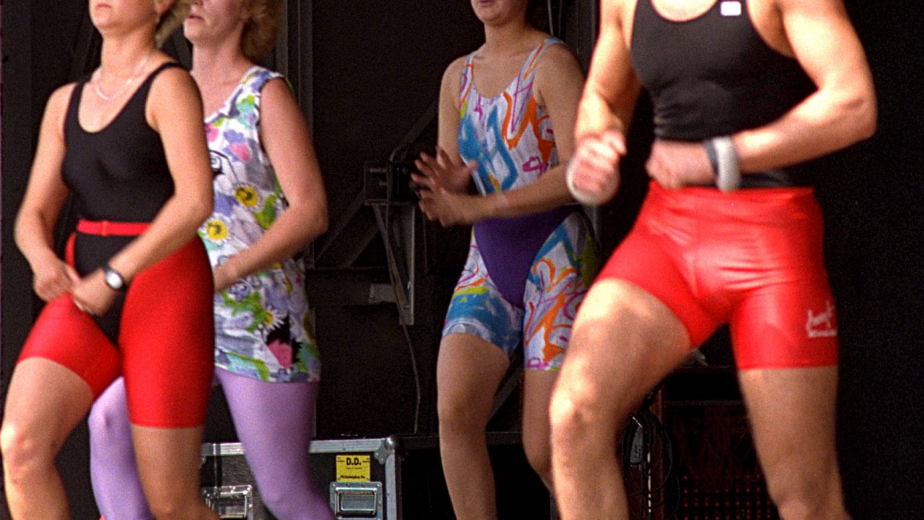
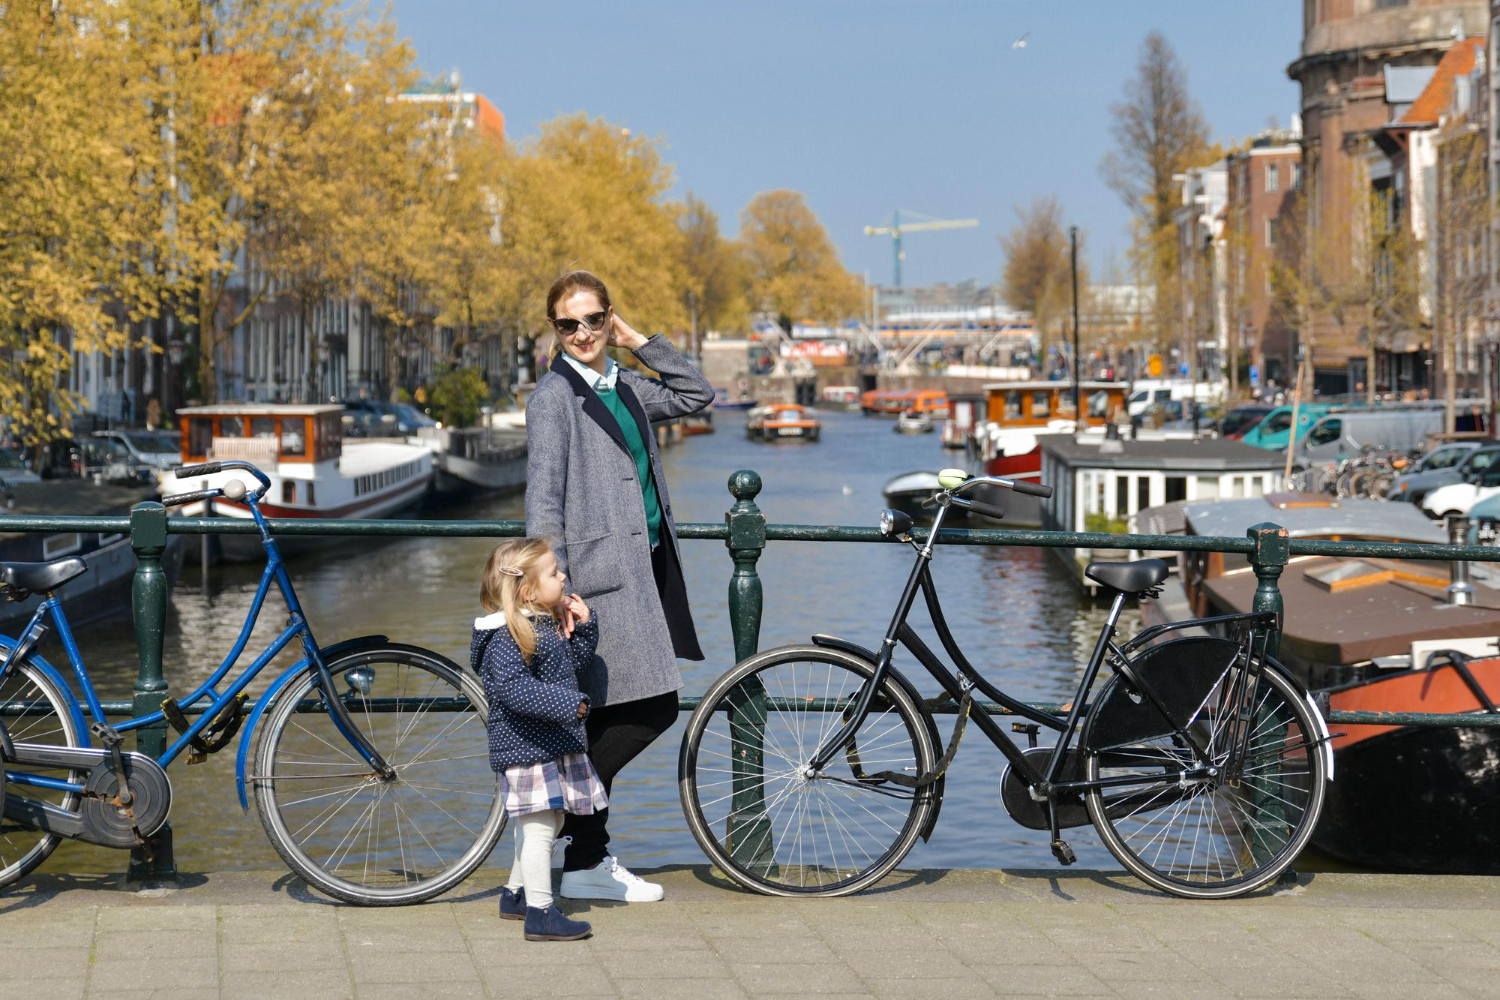
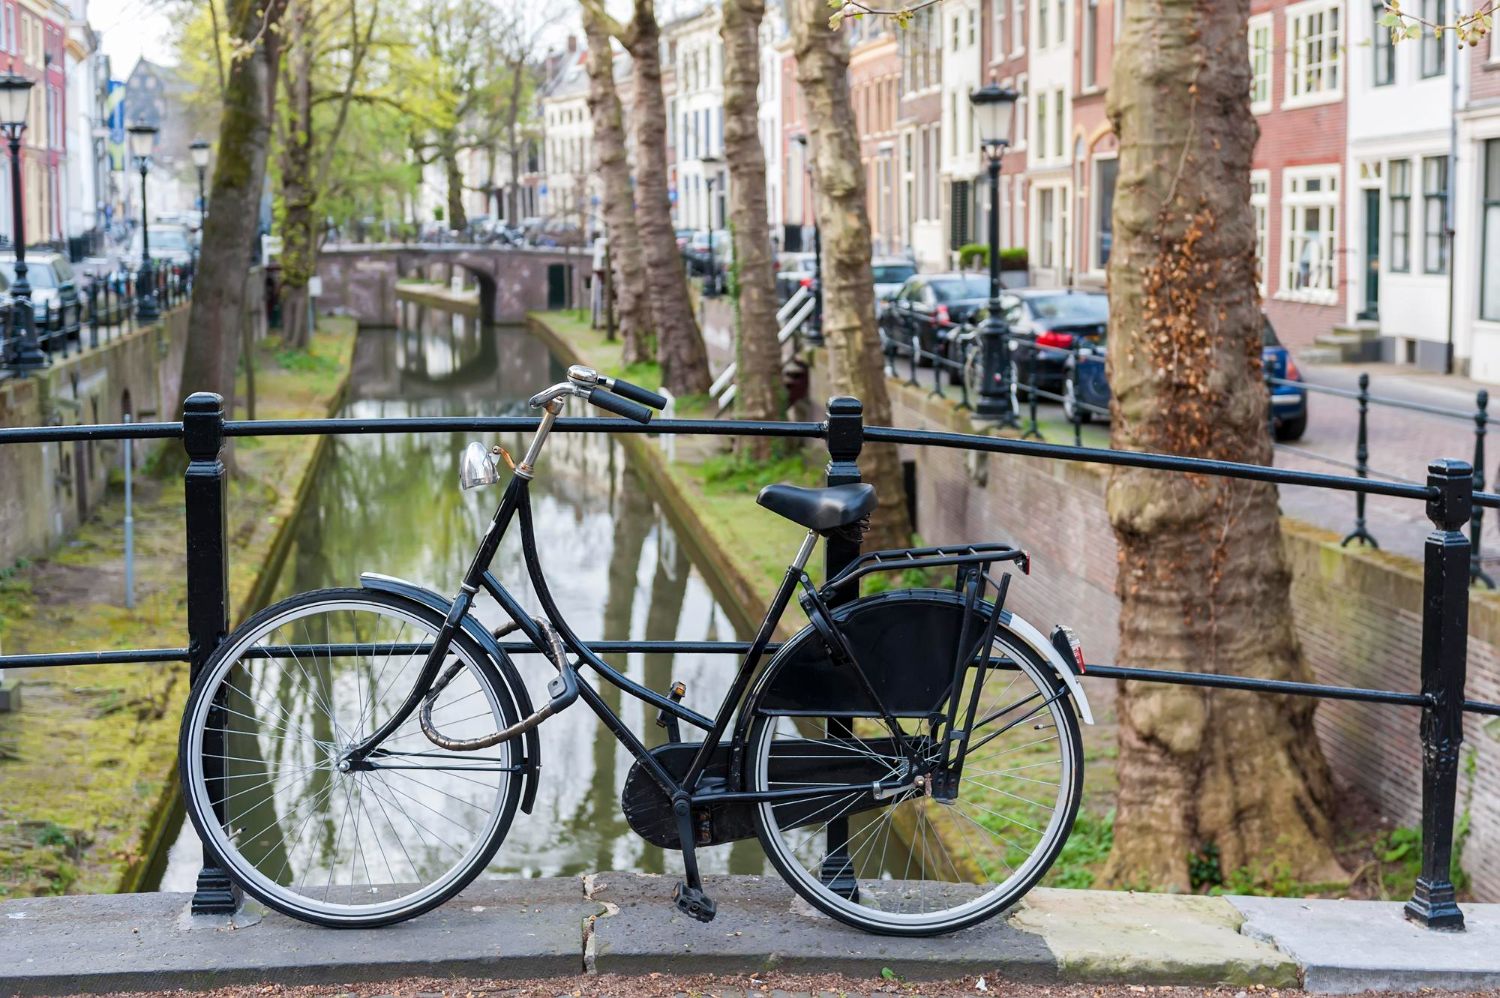
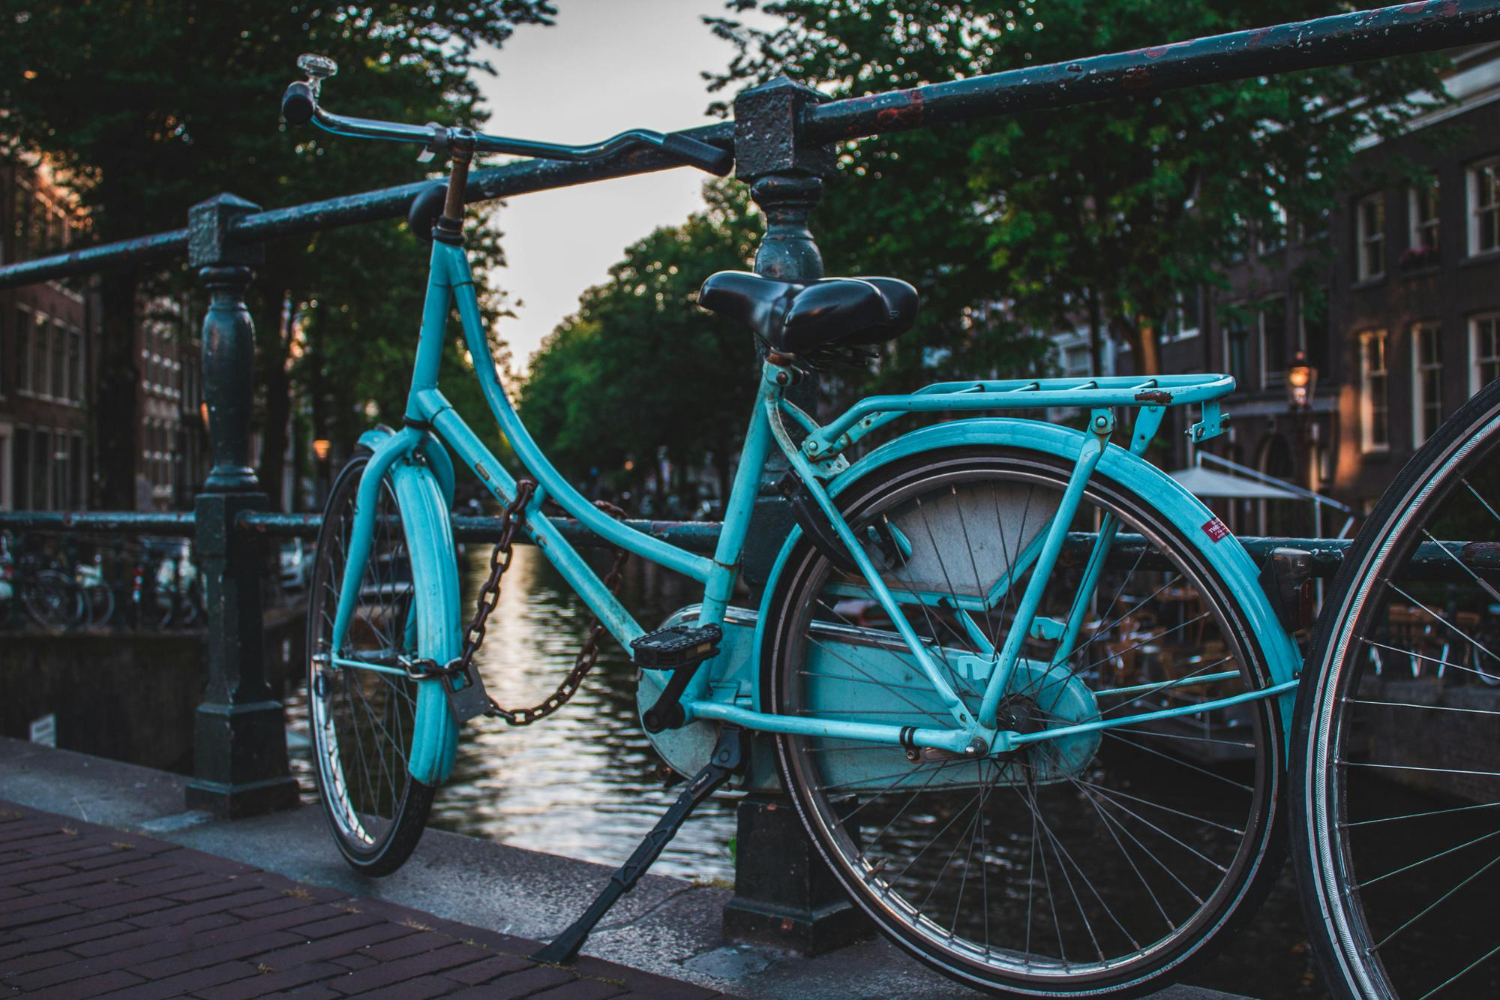
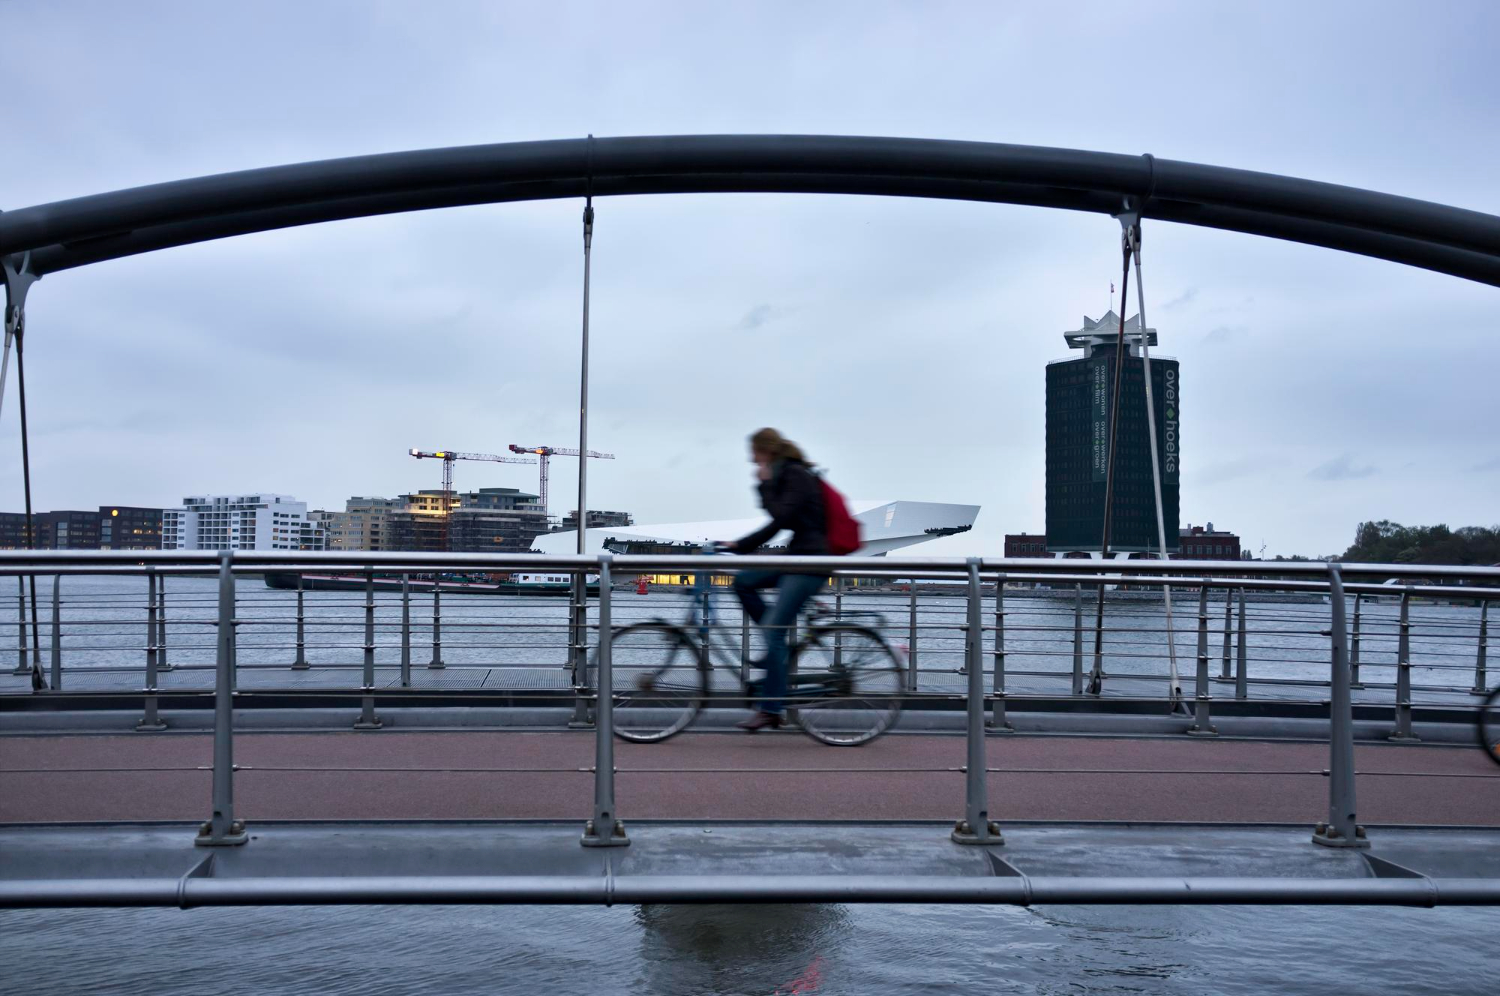
Daily Dutch cycling differs substantially from American or British recreational cycling. Most Dutch cyclists wear regular clothes (business attire, school uniforms, work clothes) rather than specialized cycling gear. Helmets are uncommon among adult Dutch cyclists (this is genuinely controversial among international cycling advocates). Bicycles are typically practical “city bikes” with upright posture, fenders, lights, and racks rather than specialized sport models. Trips are short (averaging 3-5 km) and integrated into daily routines rather than treated as exercise. Children cycle independently from young ages (5-6 years old typically begin solo cycling). The integration is total — cycling isn’t a hobby or sport but the primary daily transportation method.
The Specific Cycling Statistics
Dutch cycling occurs at substantially different volumes than other countries. Approximately 27% of all trips in the Netherlands are made by bicycle. In Amsterdam specifically, this rises to approximately 40% of trips. Over 99% of Dutch people own at least one bicycle. The average Dutch person cycles approximately 1,000 kilometers annually. Children cycle to school at rates approaching 70% in many areas. Adults cycle to work at rates approaching 30%. These numbers dwarf cycling statistics from any other country except possibly Denmark (which adopted similar policies around the same time). The cultural normalization of cycling produces substantial population-level health, environmental, and transportation outcomes.
Why Other Countries Cannot Easily Replicate This
The Dutch cycling success is substantially harder to replicate than copying the infrastructure suggests. Several specific factors complicate replication. Geography matters — the Netherlands is famously flat, making cycling easier than in hilly cities. Climate is mild, with relatively few extreme weather days. Density is high, with most destinations within reasonable cycling distance. Decades of sustained investment have produced cumulative infrastructure that newer attempts cannot match in short timeframes. Cultural integration takes generations rather than years. Political will requires sustained commitment across multiple election cycles. Most countries attempting Dutch-style cycling have made partial changes that don’t produce equivalent results because the cumulative system depends on multiple reinforcing elements.
What Modern Cities Are Actually Doing
Many cities have attempted to copy elements of Dutch cycling success. Copenhagen has achieved similar cycling rates through similar policies (and is sometimes credited with being more cycling-focused than the Netherlands). Paris has substantially expanded cycling infrastructure since 2020 under Mayor Anne Hidalgo’s “15-minute city” policies. New York City has built substantial cycling infrastructure under various mayors. Various other cities have made partial efforts. The results have been mixed. Cities that have made substantial sustained investments have seen cycling rates increase substantially. Cities that have made partial efforts have produced limited results. The Dutch lesson is that comprehensive sustained investment matters more than partial implementation.
What This Reveals About Urban Policy
The Dutch cycling story reveals something specific about urban policy generally. Cultural patterns that look natural or inevitable often result from specific policy decisions that could have been different. The Dutch could have continued automobile-centric development through the 1970s and 1980s; specific decisions in response to specific crises produced the alternative trajectory. Other countries could potentially achieve similar results through similar decisions, but the cumulative investment requirements are substantial. Quick fixes don’t produce Dutch results. The cumulative system depends on infrastructure, policy, cultural integration, and political will sustained across decades. Cities seeking Dutch-style cycling outcomes need to commit to multi-decade investment programs rather than expecting quick transformation through partial measures.
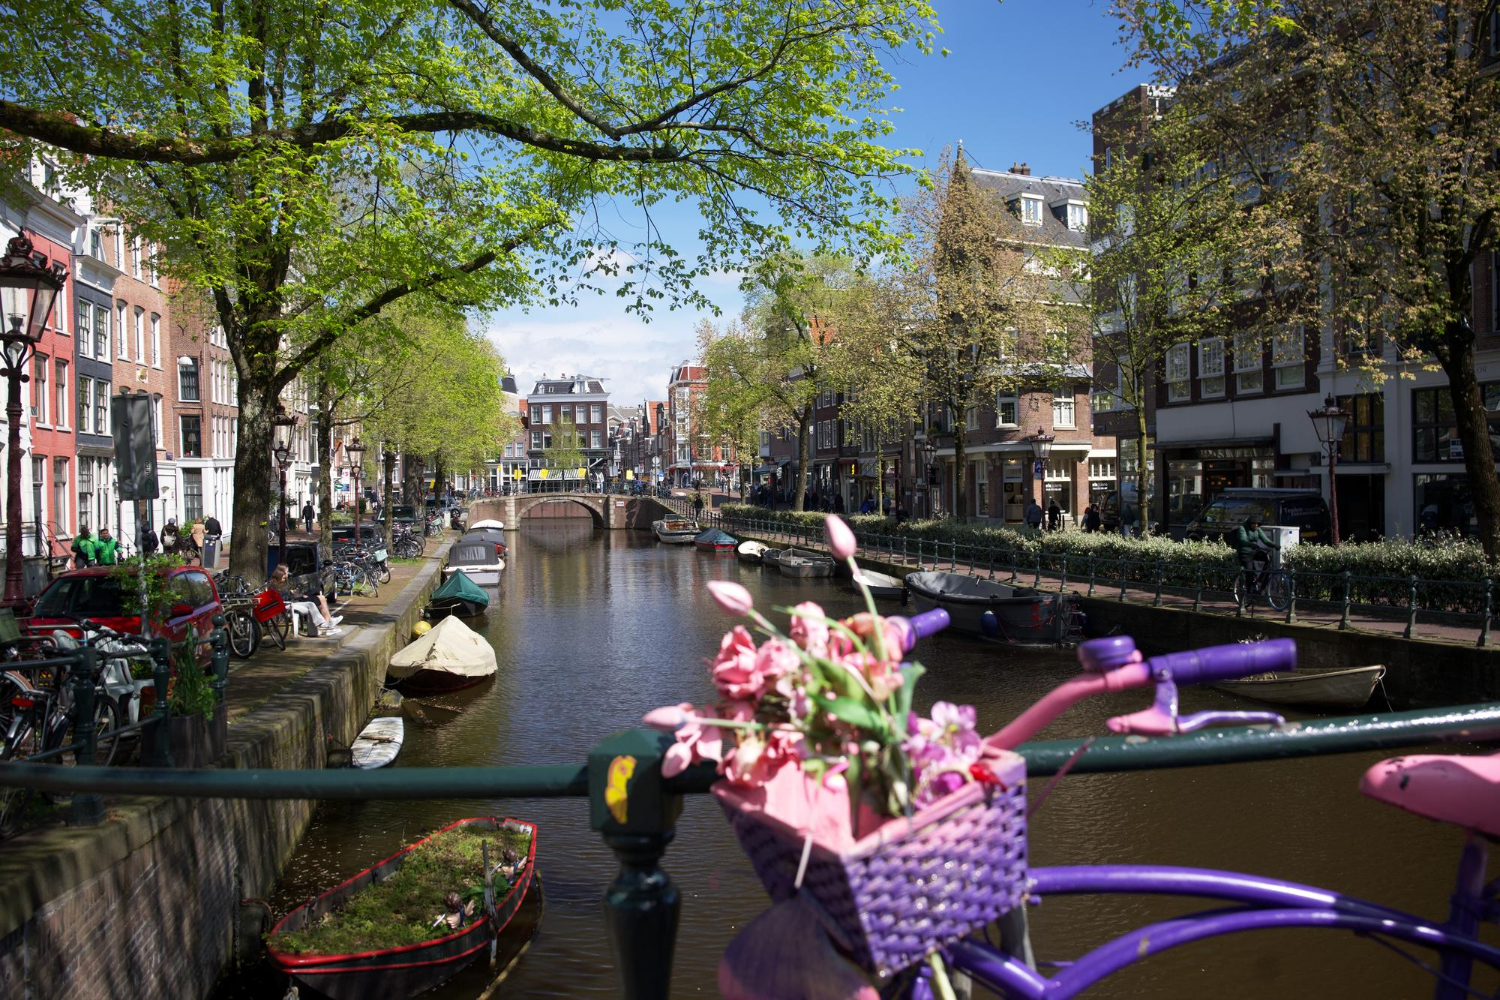
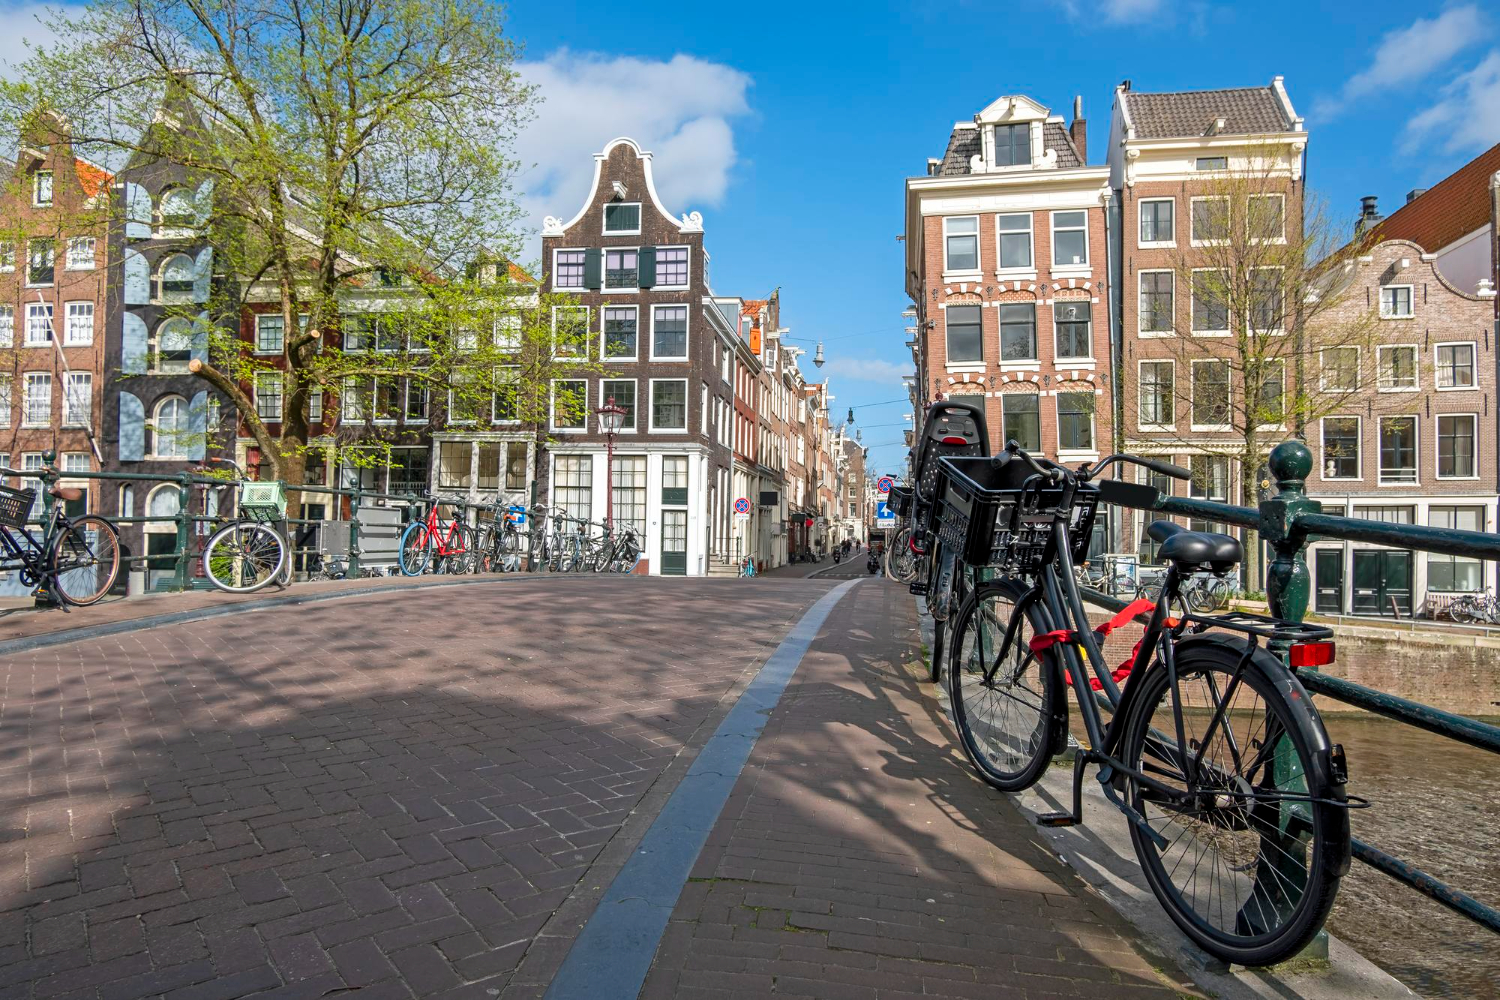
What Visitors Actually Experience
For travelers visiting the Netherlands, the cycling experience is genuinely accessible and remarkable. Most cities have bicycle rental at reasonable prices (€10-15 per day). Major train stations have bicycle rental services and substantial bicycle storage. Cycling routes are typically well-marked with directional signage. Tourist-focused bicycle routes connect major attractions in cities like Amsterdam, Utrecht, and various other cities. Long-distance cycling routes connect cities and rural attractions. The experience differs substantially from cycling in tourist-focused American cities — it’s more practical, less recreational, more integrated with daily life. Visitors typically describe Dutch cycling as one of the more memorable aspects of their travel.
What Dutch Cycling Actually Represents
The Dutch cycling phenomenon represents what’s possible when comprehensive infrastructure, sustained political will, and cultural integration align over multiple decades. It’s not a Dutch cultural inevitability — it’s the result of specific decisions made in response to specific crises, sustained through ongoing investment and political commitment. The 23 million bicycles serving 17.6 million people aren’t an accident. They’re the result of approximately 50 years of consistent policy choices that prioritized cycling infrastructure over alternatives. Other countries could potentially achieve similar results through similar choices, but the time horizon is generational rather than electoral. The Dutch lesson isn’t really about cycling — it’s about what’s achievable when infrastructure, policy, and culture align around specific goals over extended timeframes. Most countries don’t have political systems designed for the kind of sustained commitment that Dutch success required.