The American weather experience varies more dramatically by location than perhaps any comparable factor in domestic life. New Orleans averages 64 inches of annual rainfall. Phoenix averages 110 days per year with temperatures exceeding 100 degrees Fahrenheit. Buffalo averages 95 inches of annual snowfall. International Falls, Minnesota reaches -30 degrees Fahrenheit during an average winter. The variation produces concrete differences in housing costs, infrastructure spending, residential mobility, and resident satisfaction. The 2026 ranking below combines NOAA’s official weather data (precipitation, snowfall, temperature extremes, severe weather frequency) with resident-satisfaction surveys from WalletHub, Niche.com, and AAA’s annual livability index. The result identifies the 10 American cities where the combination of measurable weather data and reported resident frustration produces the worst overall weather profile. The list is not the same as the cities with the most-extreme single weather metric — Buffalo has more snow, Phoenix has more heat, Miami has more hurricanes. The cities below have combinations of multiple difficult weather factors.
1. New Orleans, Louisiana

New Orleans consistently ranks as the worst major American city for weather across multiple analytical frameworks. The city sits below sea level, receives approximately 64 inches of annual rainfall (one of the highest totals among major U.S. cities), experiences extreme summer humidity (heat index regularly exceeding 110 degrees Fahrenheit), and faces sustained hurricane risk during the June-November season. Hurricane Katrina (2005), Hurricane Isaac (2012), Hurricane Ida (2021), and ongoing levee system stress have combined to produce among the highest weather-related insurance premiums in the United States. New Orleans residents report among the lowest weather-related satisfaction scores in any major American city. The cultural appeal of the city is enormous, but the weather profile is genuinely difficult.
2. Phoenix, Arizona
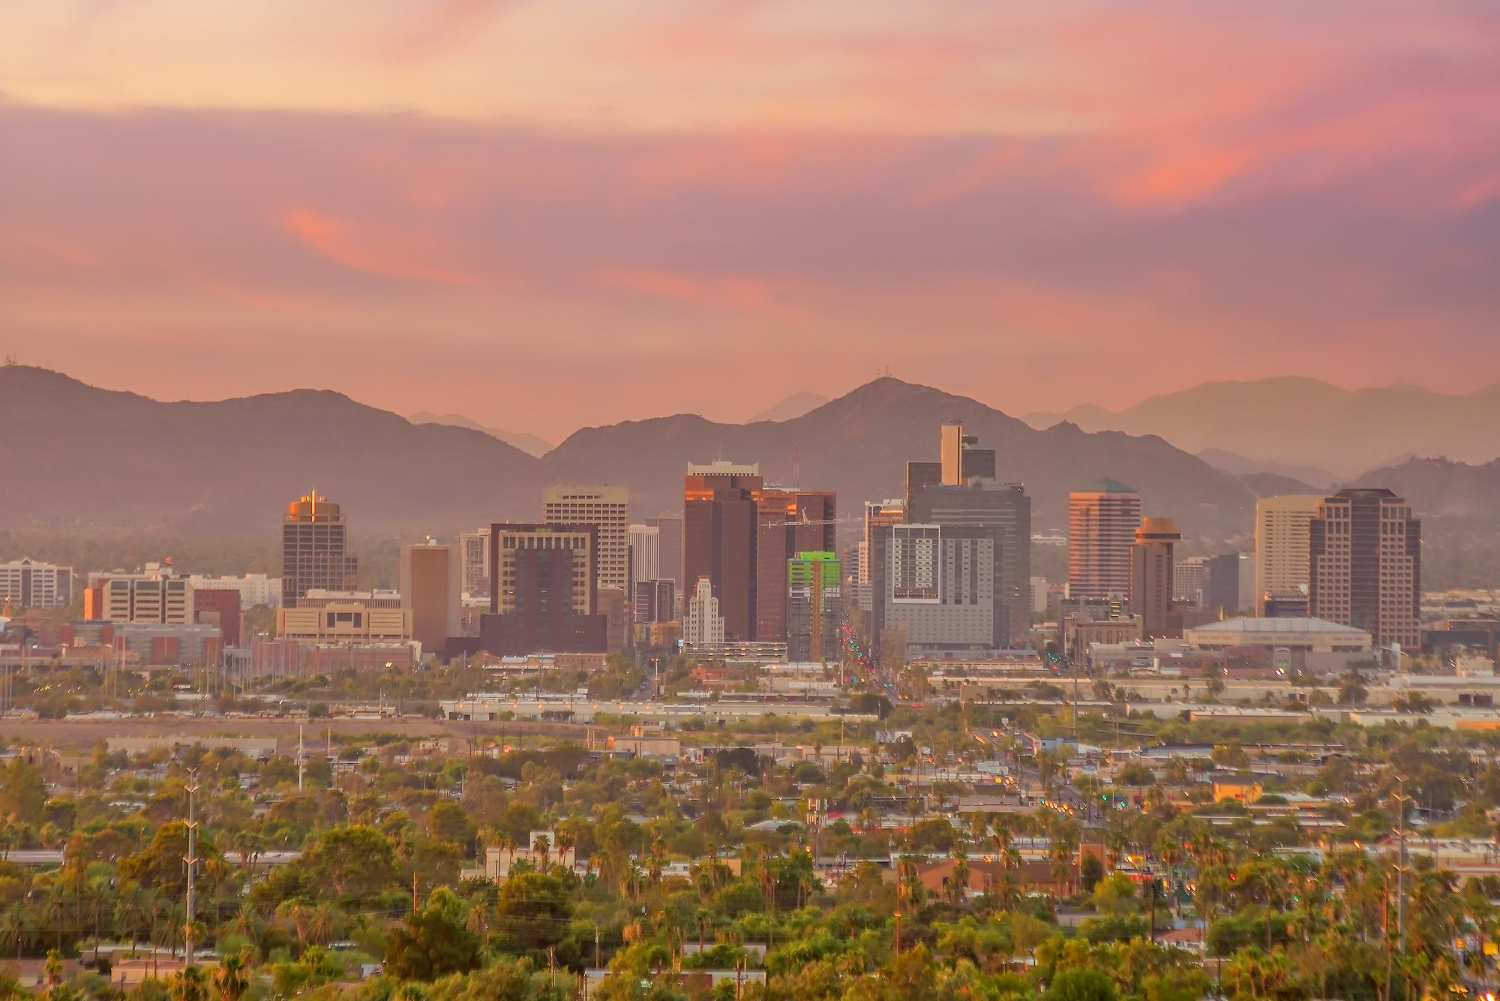
Phoenix faces the inverse problem — extreme heat rather than extreme rain. The city averages approximately 110 days per year with daytime highs exceeding 100 degrees Fahrenheit, and the 2024 and 2025 summers each included multi-week stretches with overnight low temperatures above 90 degrees. The “urban heat island” effect makes Phoenix substantially hotter than the surrounding Sonoran Desert. The 2024 summer recorded 113 consecutive days with high temperatures of 100 degrees or higher, breaking the previous all-time U.S. record. The Phoenix metropolitan area continues to grow rapidly despite the weather, but resident satisfaction surveys show substantial weather-related frustration particularly among newer residents.
3. Miami, Florida
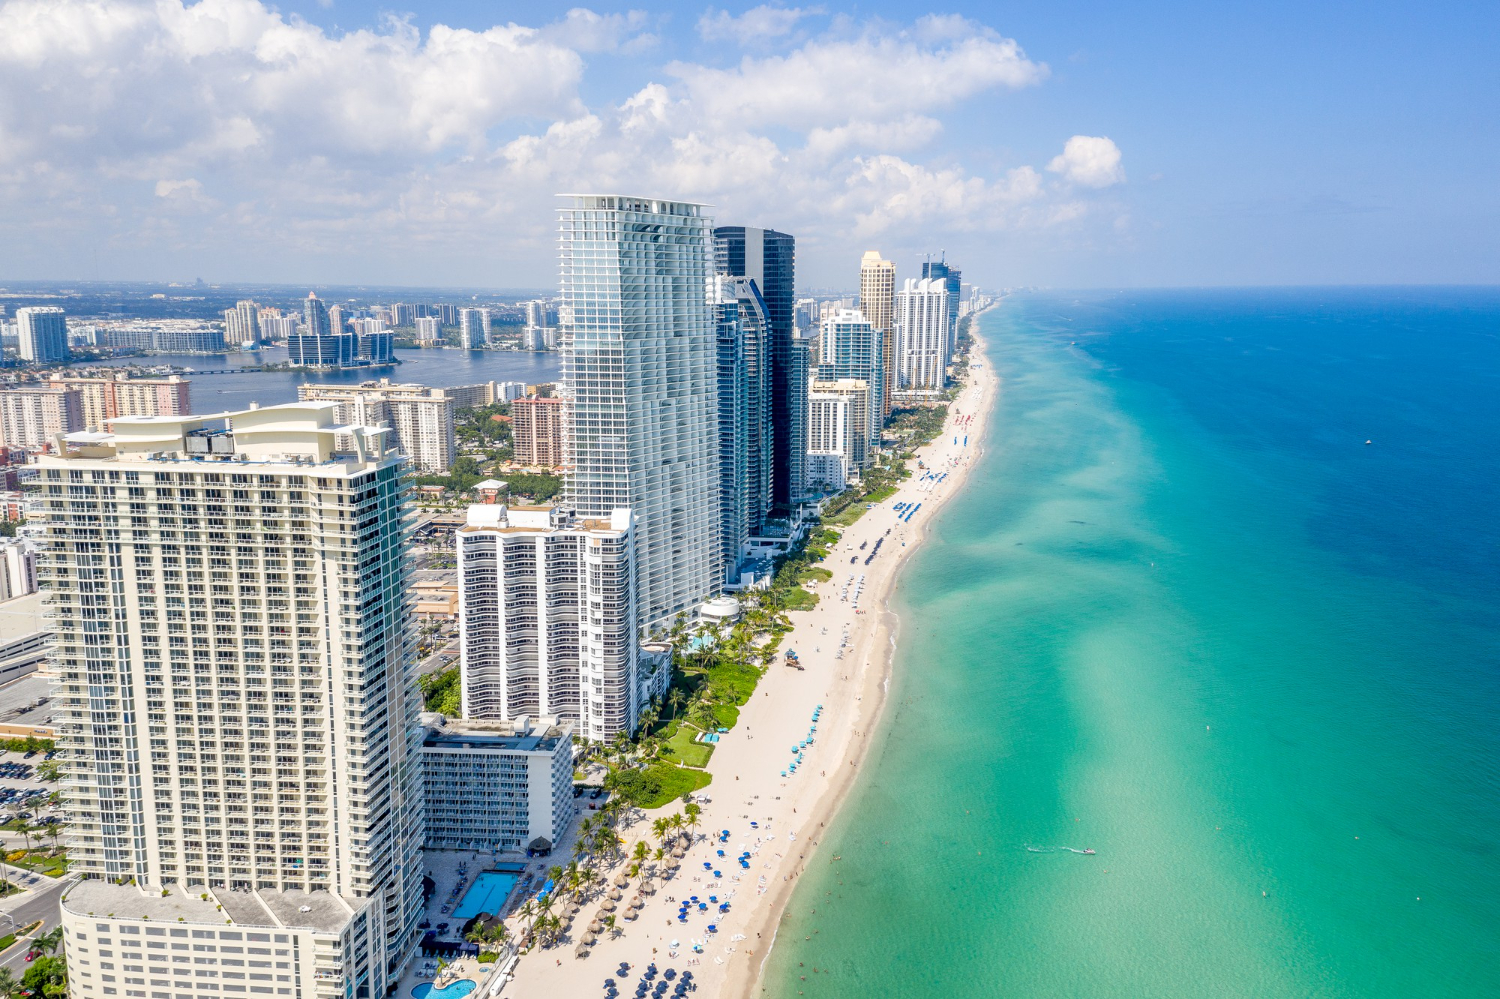
Miami faces a different weather profile dominated by hurricane risk, extreme humidity, and rising sea level concerns. The city averages approximately 62 inches of annual rainfall, sustained 80-90 degree summer temperatures with 80+ percent humidity, and the highest hurricane exposure of any major American metropolitan area. The 2017 Hurricane Irma, 2022 Hurricane Ian, and continuing flooding from king tides have produced substantial infrastructure stress. Miami residents pay among the highest homeowners insurance premiums in the United States, with multiple major insurers having exited the Florida market entirely. The weather frustration is balanced against the cultural and economic appeal, but the underlying weather data is difficult.
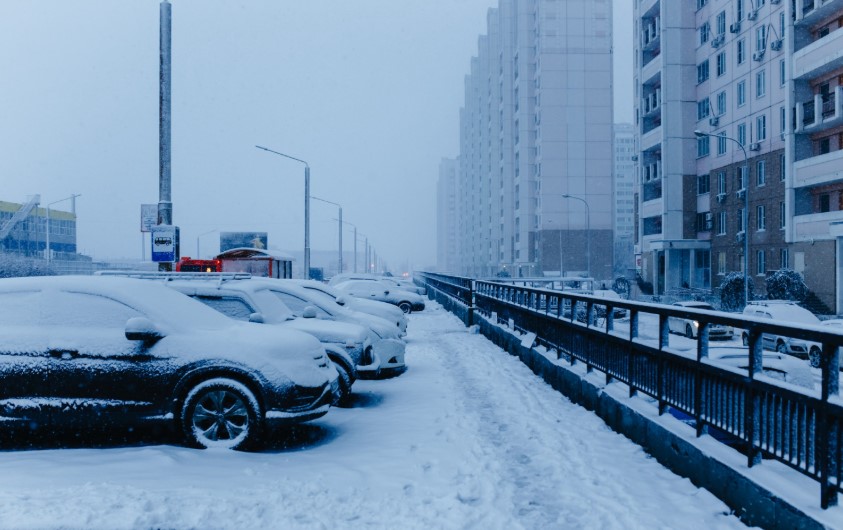
4. International Falls, Minnesota
International Falls — population approximately 5,500 — sits on the Canadian border in northern Minnesota and is regularly the coldest American town with weather instruments. The city’s average January temperature is approximately 5 degrees Fahrenheit. The all-time record low is -55 degrees Fahrenheit. The annual snowfall averages approximately 65 inches. The growing season is approximately 100 days. The town has trademarked the nickname “Icebox of the Nation” and uses the extreme cold as a tourism asset, but the resident satisfaction surveys reflect the genuine difficulty of the winter experience.
5. Houston, Texas

Houston combines New Orleans-style flooding with Phoenix-style heat. The city averages approximately 53 inches of annual rainfall (high among major U.S. cities), faces sustained 95+ degree summer temperatures with 85 percent humidity, and experienced Hurricane Harvey (2017) flooding that produced over $125 billion in damage — the costliest single weather event in U.S. history. The city’s flooding vulnerability has produced recurring infrastructure stress, with major flooding events occurring with greater frequency since 2015. Houston has continued to grow rapidly despite the weather but resident satisfaction surveys show meaningful weather-related frustration.
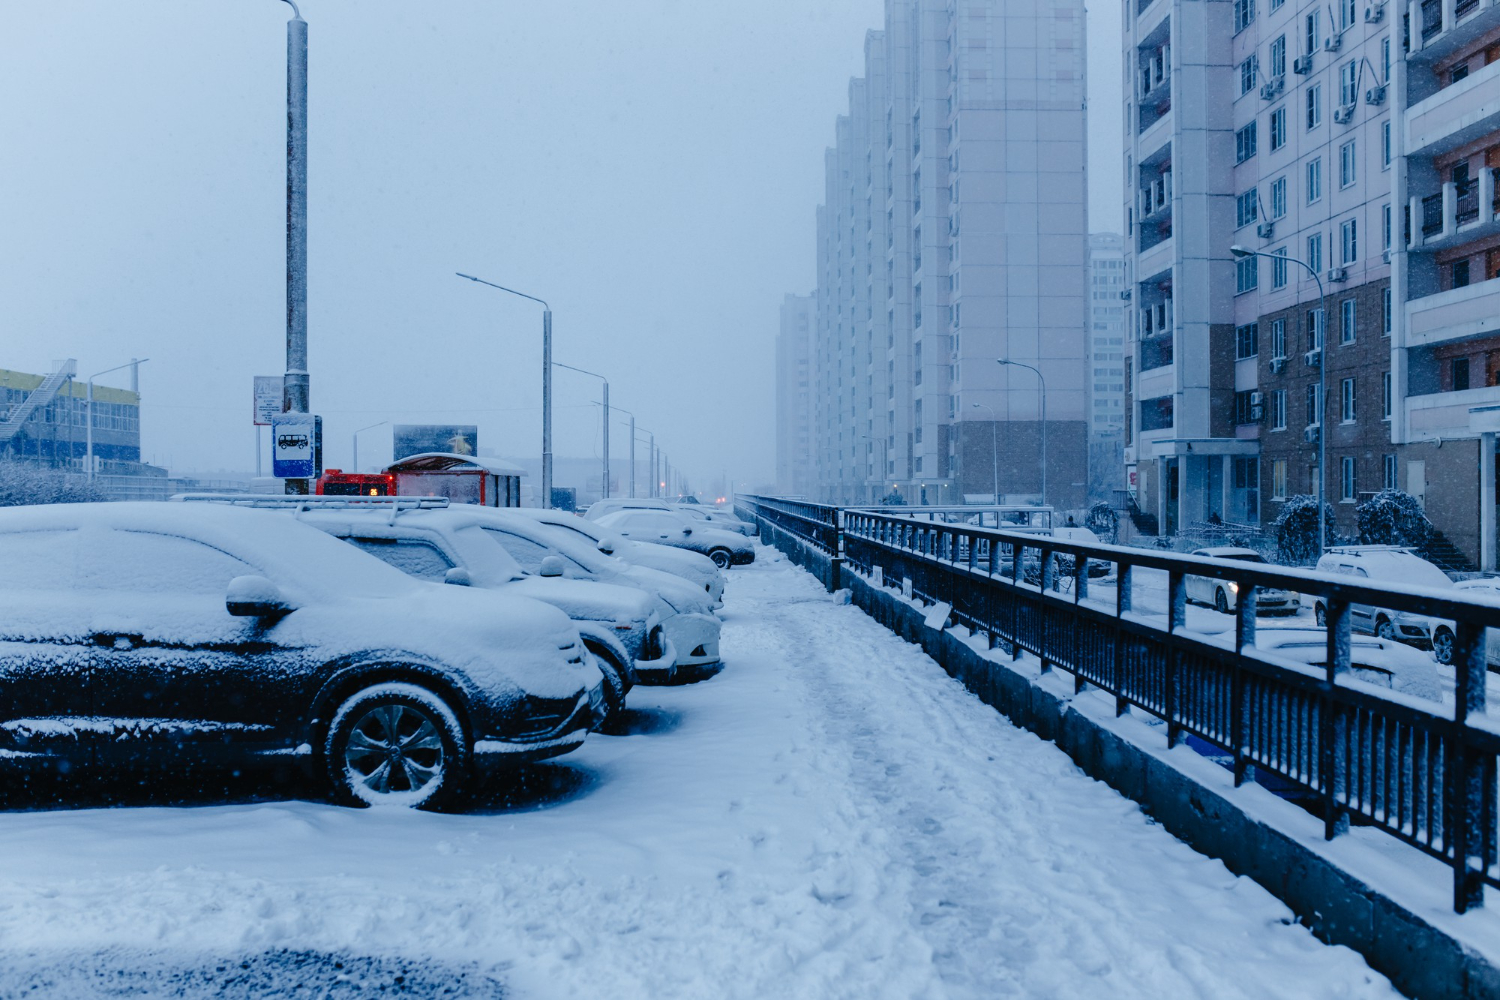
6. Buffalo, New York

Buffalo faces the most extreme winter weather of any major American city. The city averages approximately 95 inches of annual snowfall — among the highest snowfall totals of any major U.S. city — driven primarily by lake-effect snow from Lake Erie. The 2014 “Snowvember” storm produced 65 inches of snow in three days. The December 2022 blizzard killed 47 residents during a Christmas-week storm with sustained 70 mph winds and -10 degree temperatures. The city’s residents are typically resilient about the weather, but the cumulative weather data produces consistently low satisfaction scores in the lifestyle rankings.
7. Mobile, Alabama
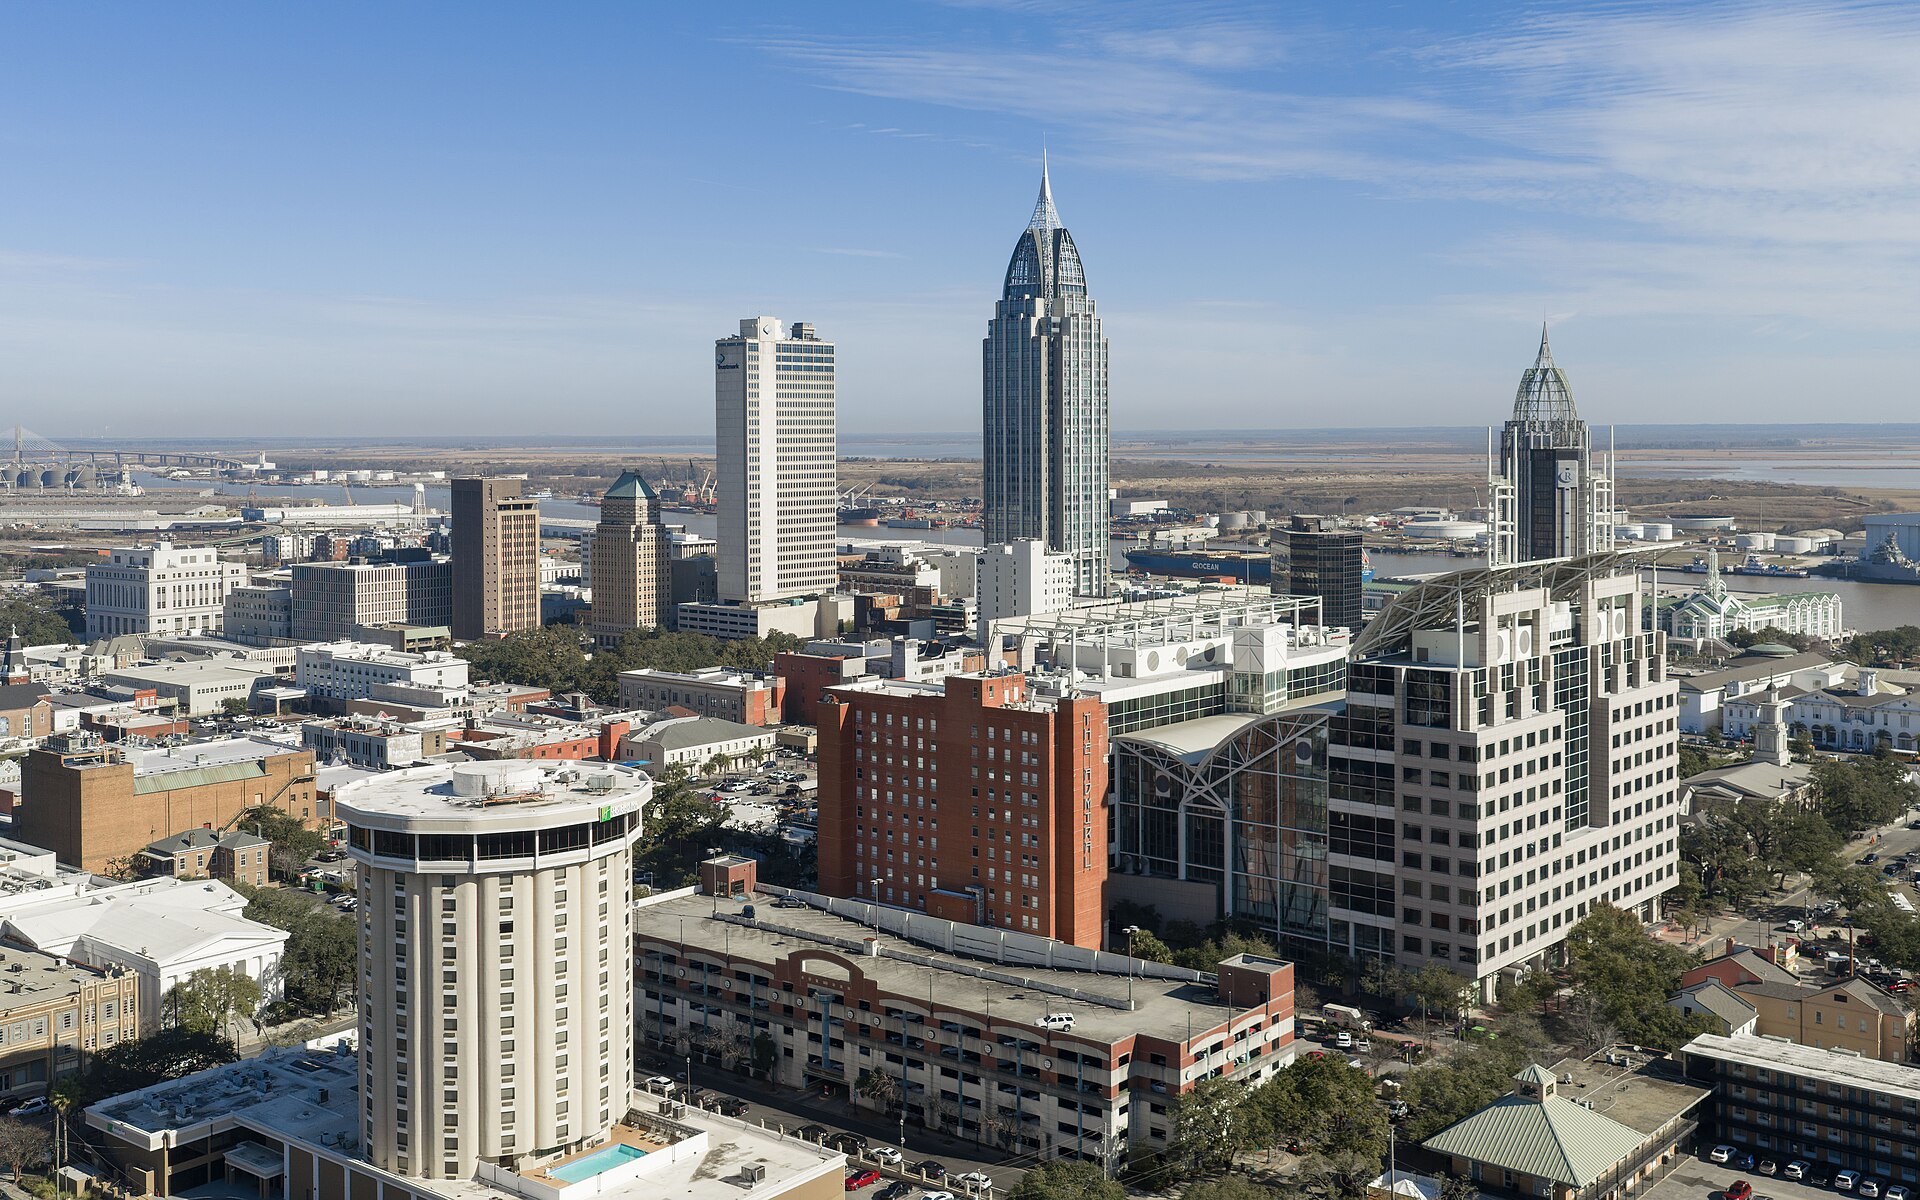
Mobile averages approximately 67 inches of annual rainfall — one of the highest totals among all U.S. cities — driven by both the Gulf of Mexico’s evaporation patterns and the city’s geographic position relative to Gulf storm tracks. Mobile faces direct hurricane exposure, sustained summer humidity, and the highest annual rainfall of any major Southern U.S. city. The city’s residents have historically tolerated the weather as a trade-off for the city’s substantial cultural and historic character (oldest American Mardi Gras tradition, antebellum architecture, Gulf Coast cuisine), but the weather data alone places Mobile near the top of any objective “worst weather” ranking.
8. Anchorage, Alaska
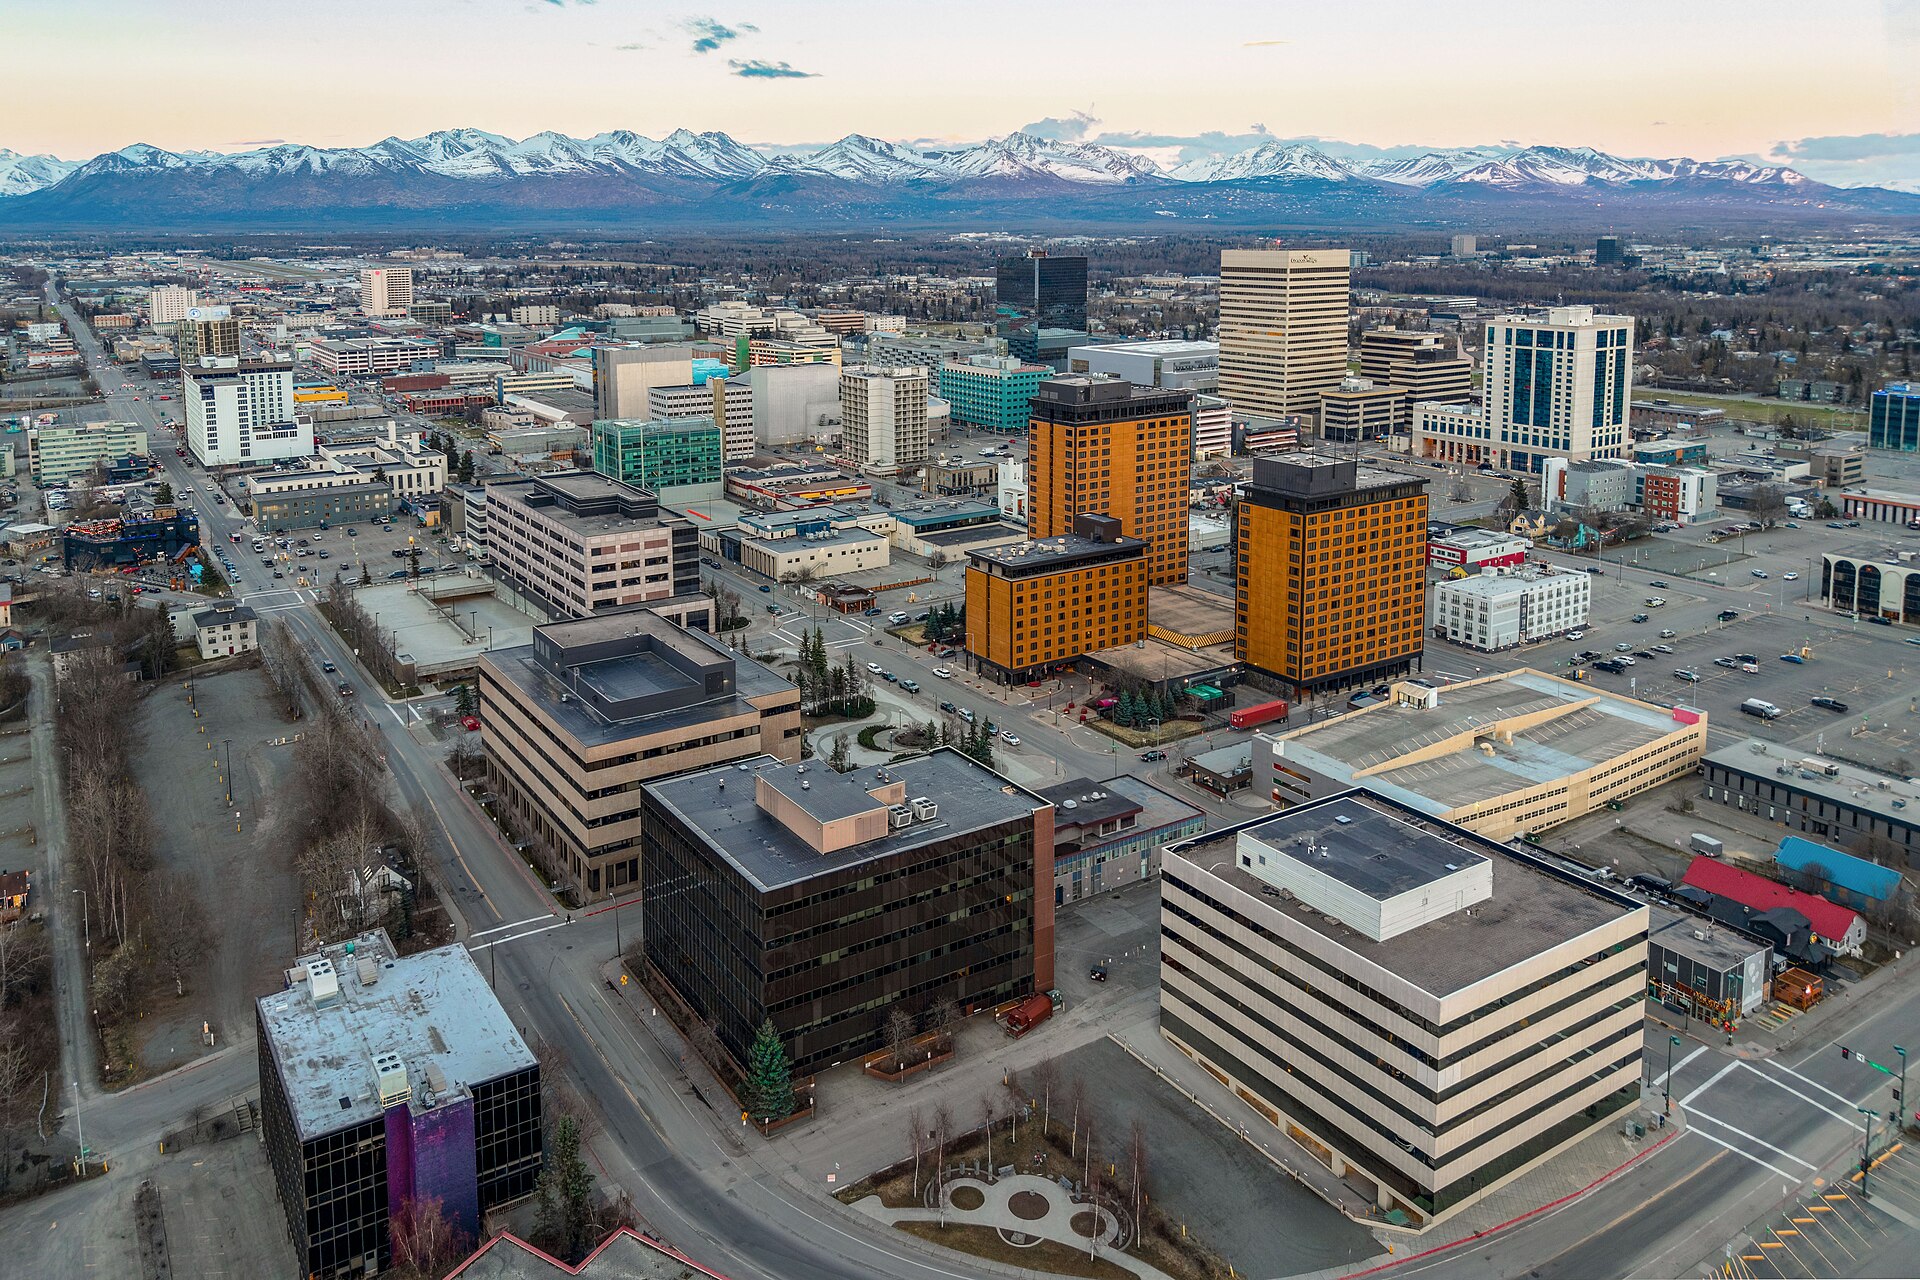
Anchorage faces a combination of severe winter cold, limited daylight (approximately 5 hours of daylight at winter solstice), and the broader Alaskan isolation from continental American services. The city’s average January temperature is approximately 15 degrees Fahrenheit. The annual snowfall averages approximately 75 inches. The winter darkness lasts approximately 5 months at substantial intensity. Anchorage residents typically express strong attachment to the city despite the weather, but the weather data produces consistently low satisfaction scores in lifestyle rankings.
9. Memphis, Tennessee

Memphis faces what climatologists call the “weather purgatory” of the mid-South — hot, humid summers combined with persistent severe weather (tornadoes, ice storms, hailstorms) and lacking the moderating ocean effects of coastal cities. The city averages approximately 54 inches of annual rainfall, 95+ degree summers, and is in the heart of the “Dixie Alley” tornado corridor that has produced multiple major outbreaks since 2010. The combination of summer heat, severe-weather risk, and occasional ice storms produces consistently low resident weather satisfaction scores.
10. Fairbanks, Alaska
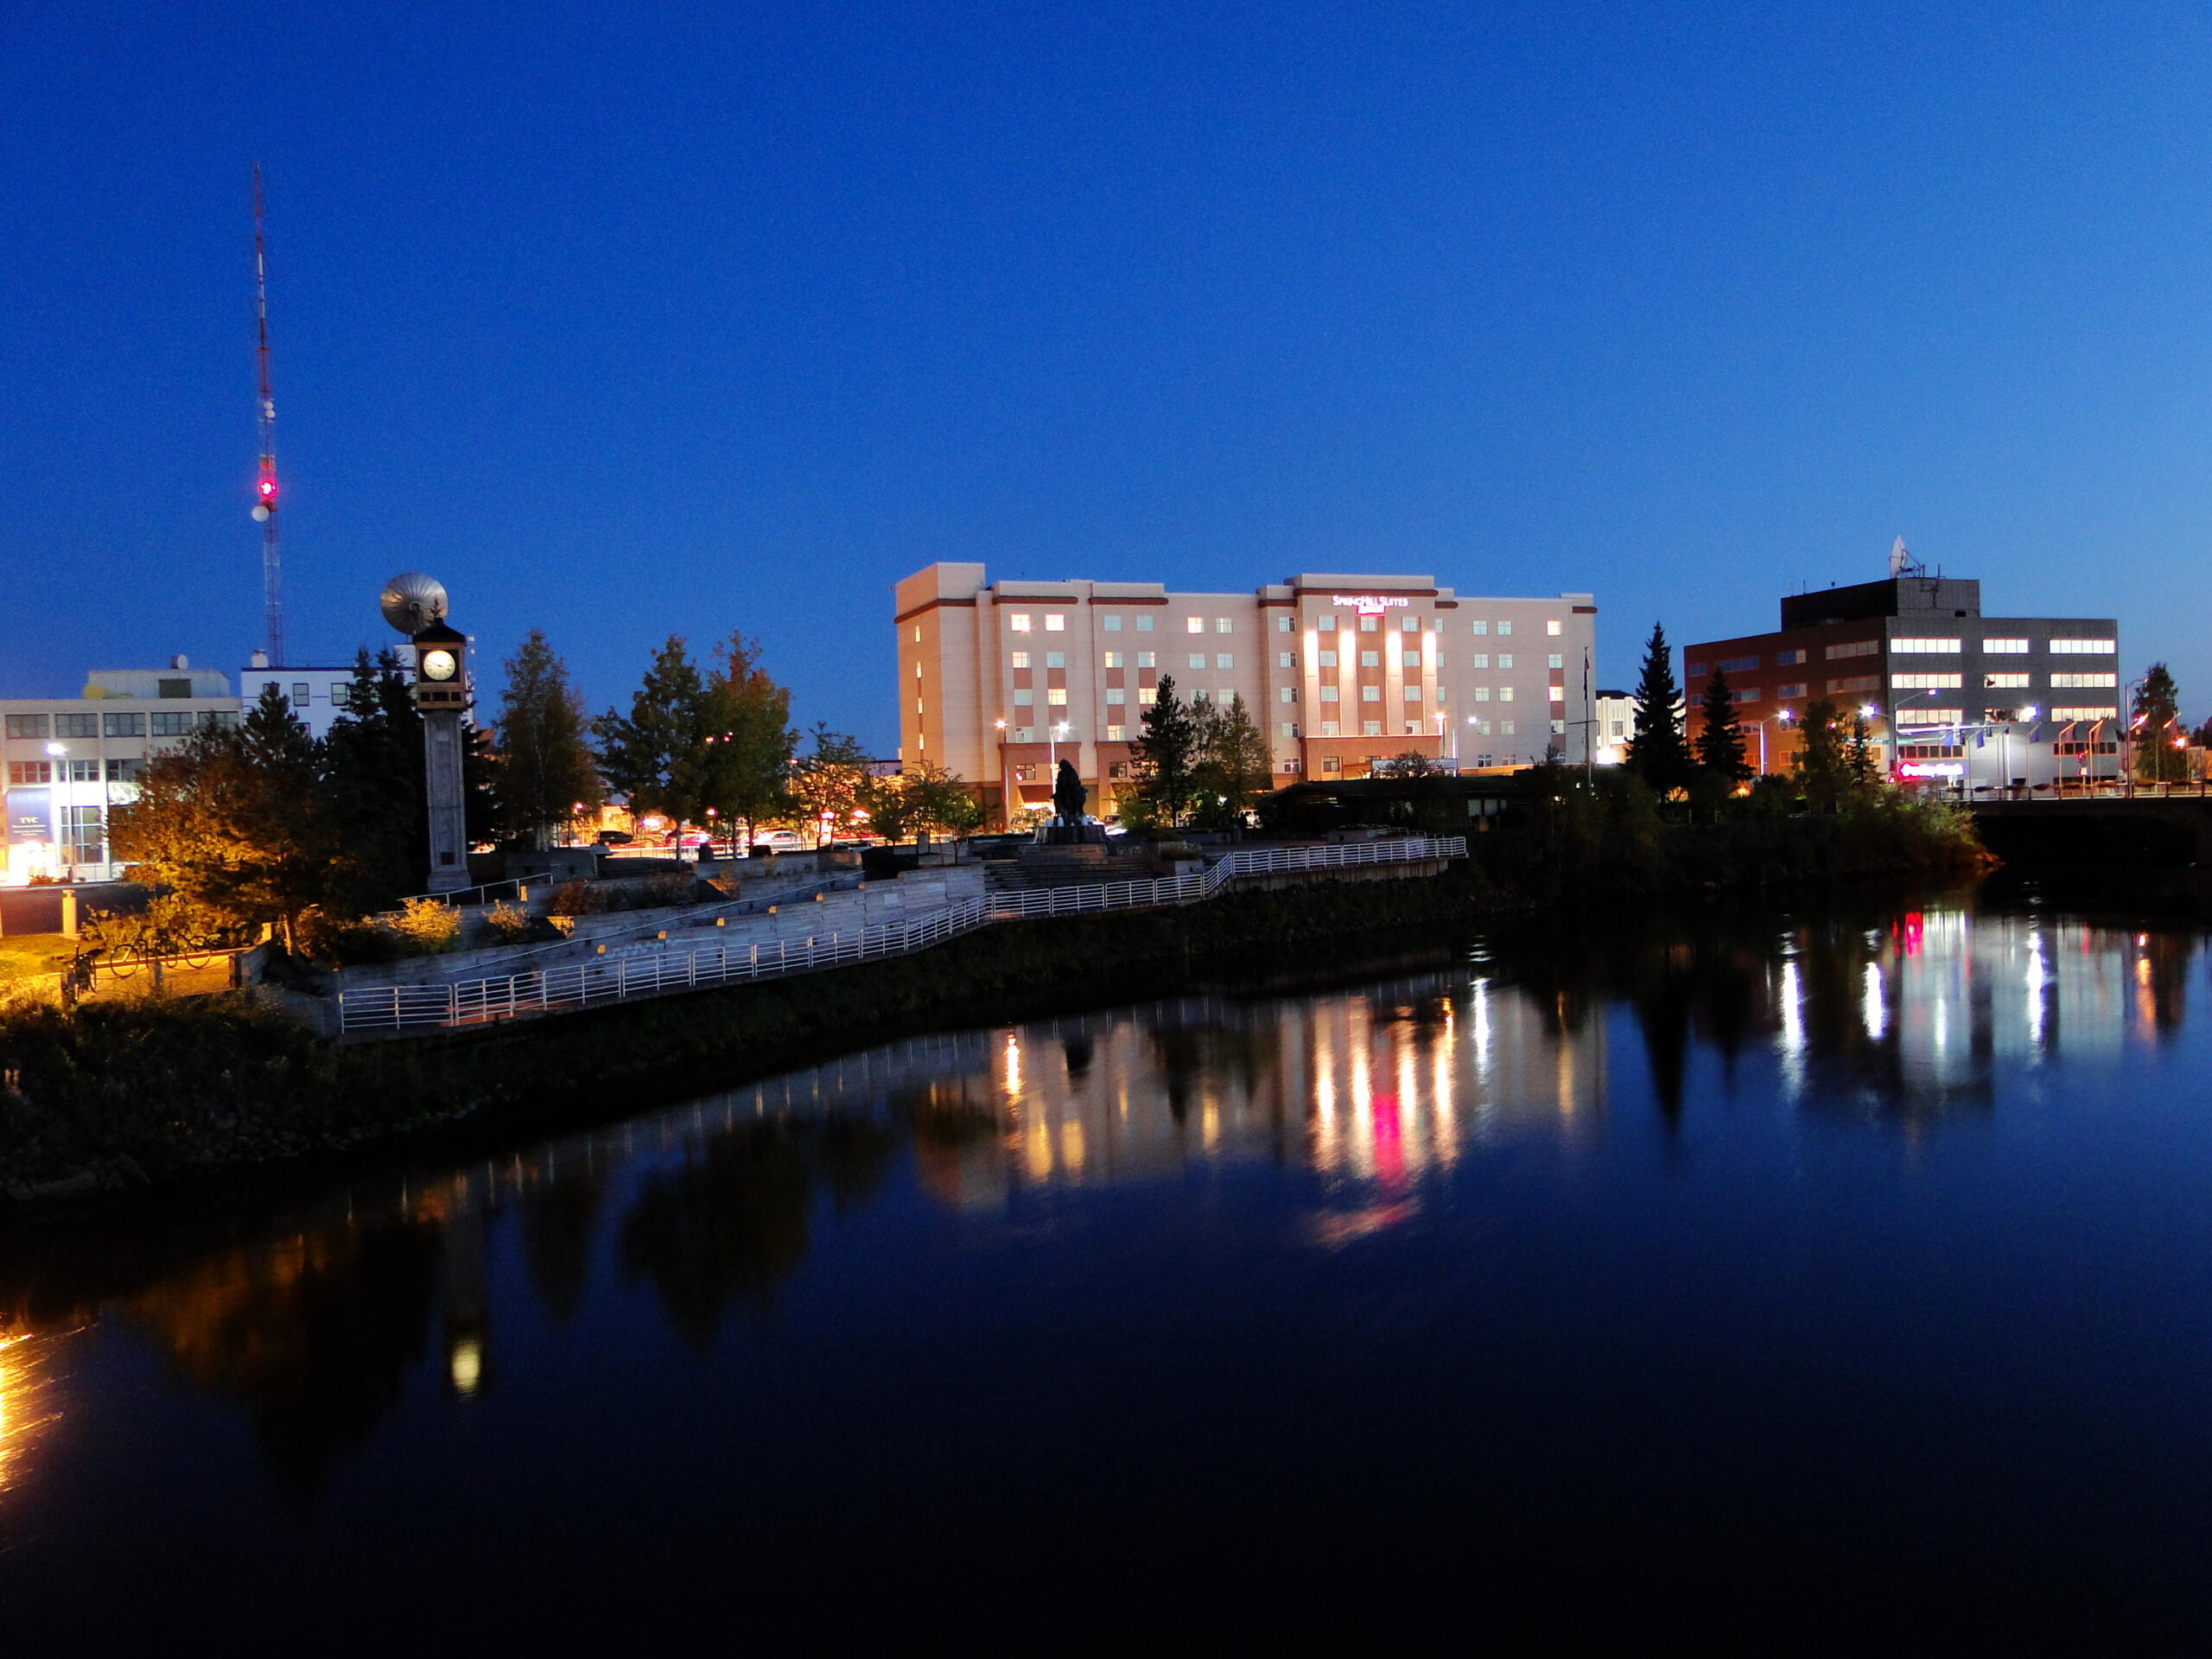
Fairbanks — population approximately 32,000 — combines the most extreme American winter cold with the most extreme summer transition. The city’s average January temperature is approximately -8 degrees Fahrenheit. Summer temperatures reach 80-85 degrees with up to 22 hours of daylight. Winter daylight falls to approximately 4 hours. The Fairbanks residents adapt to the extreme transitions, but the weather profile is among the most challenging in continental North America. Modern climate change has produced rising winter temperatures (the all-time January warm-record was set in 2024) but the underlying weather profile remains difficult.
What the Pattern Reveals

The ten cities above share specific characteristics. Each faces at least one extreme weather metric (snowfall, heat, rain, hurricane exposure, cold). Most face multiple difficult metrics simultaneously. Each city has substantial cultural, economic, or geographic appeal that has produced sustained populations despite the weather. The American weather geography varies more substantially than residents of any single city typically realize, and the cumulative weather burden on residents in these ten cities is meaningfully greater than the burden on residents of moderate-weather cities like San Diego, Honolulu, or Asheville. The patterns are likely to continue or worsen through the rest of the 2020s as climate change produces more frequent extreme events. Travelers planning relocations should pay close attention to the weather profile of any destination city — the variation in weather burden is among the largest single factors in long-term American resident satisfaction.