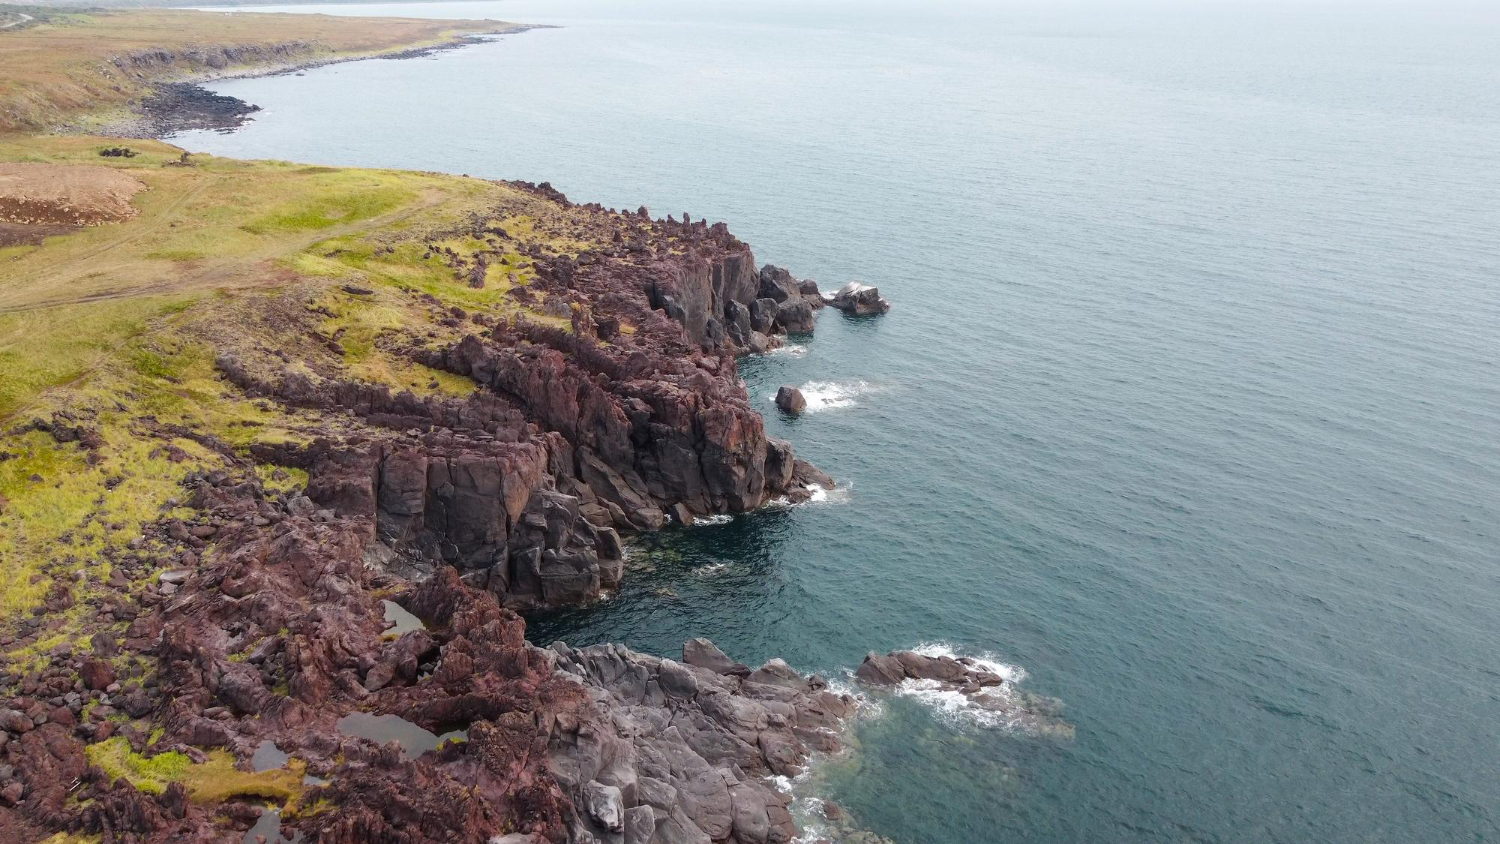
Some questions look simple and turn out to have no answer. How long is the coastline of Britain is one of them, and the discovery of why is one of the more elegant episodes in twentieth-century mathematics.
The intuition most people have is that a coastline has a length, that we may not have measured it perfectly yet, and that with better instruments we would nail it down. That is how measurement usually works. A metal bar has a length; measure it more precisely and you get closer to the true value.
Coastlines do not behave that way. Measuring in finer detail does not converge on an answer. It simply adds to the total, indefinitely.
The phenomenon is known as the coastline paradox, and it emerged from an unlikely place: a researcher investigating whether the length of a shared border predicted the likelihood of war between two countries. Here is how a question about conflict produced fractals.
The Man Counting Borders
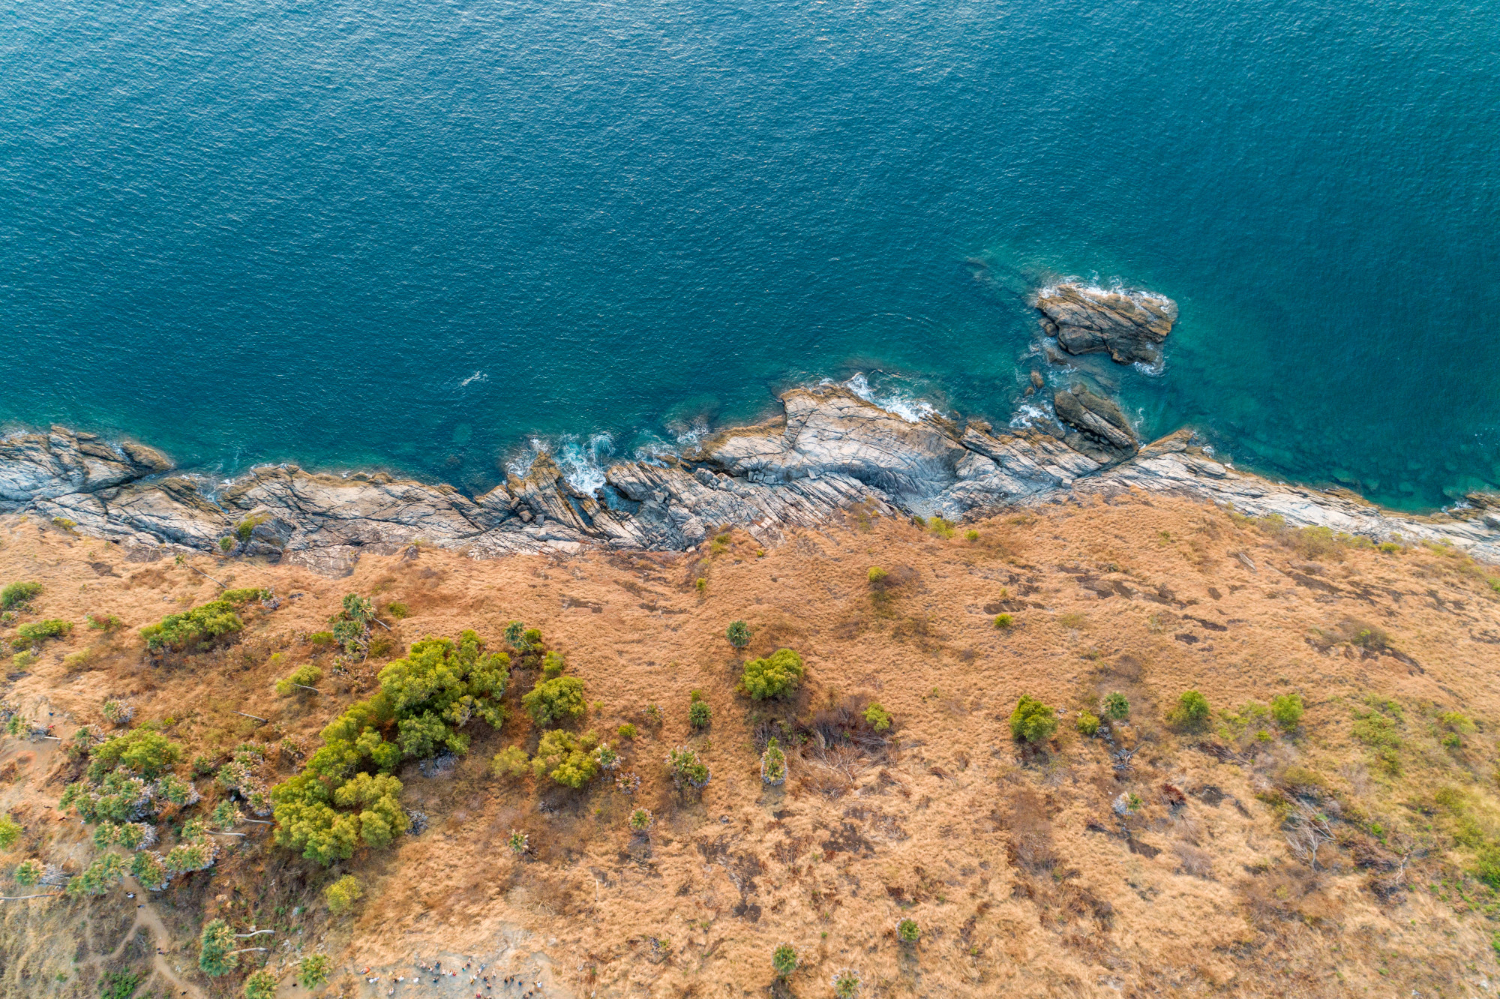
Lewis Fry Richardson was an English mathematician and meteorologist with an unusual research interest: he was trying to determine, statistically, what made wars more likely. One hypothesis he tested was that the length of the border two countries shared might be a factor.
To test it, he needed border lengths. And when he collected them, he found something odd.
Spain stated its border with Portugal as 987 kilometres. Portugal stated the same border as 1,214 kilometres — a discrepancy of 227 kilometres for a line both countries agreed on the position of.
Neither was lying. They had measured with different scales, and Richardson realised that this alone explained the gap. Using a shorter measuring unit lets you follow more of the small twists and turns, which makes the total longer.
This became known as the Richardson effect, and he published his systematic study of it in 1961. A similar “paradox of length” had been noted earlier by the Polish mathematician Hugo Steinhaus, but Richardson was the first to study it methodically.
He extended the work to coastlines and found something further: different coasts grew at different rates as the ruler shrank. Norway’s fjord-cut coastline grew far faster than Britain’s, which in turn grew faster than South Africa’s smoother coast. That rate of growth turned out to be measuring something real about the shape itself.
Like our content? Follow us for more.
Why Smaller Rulers Give Bigger Answers
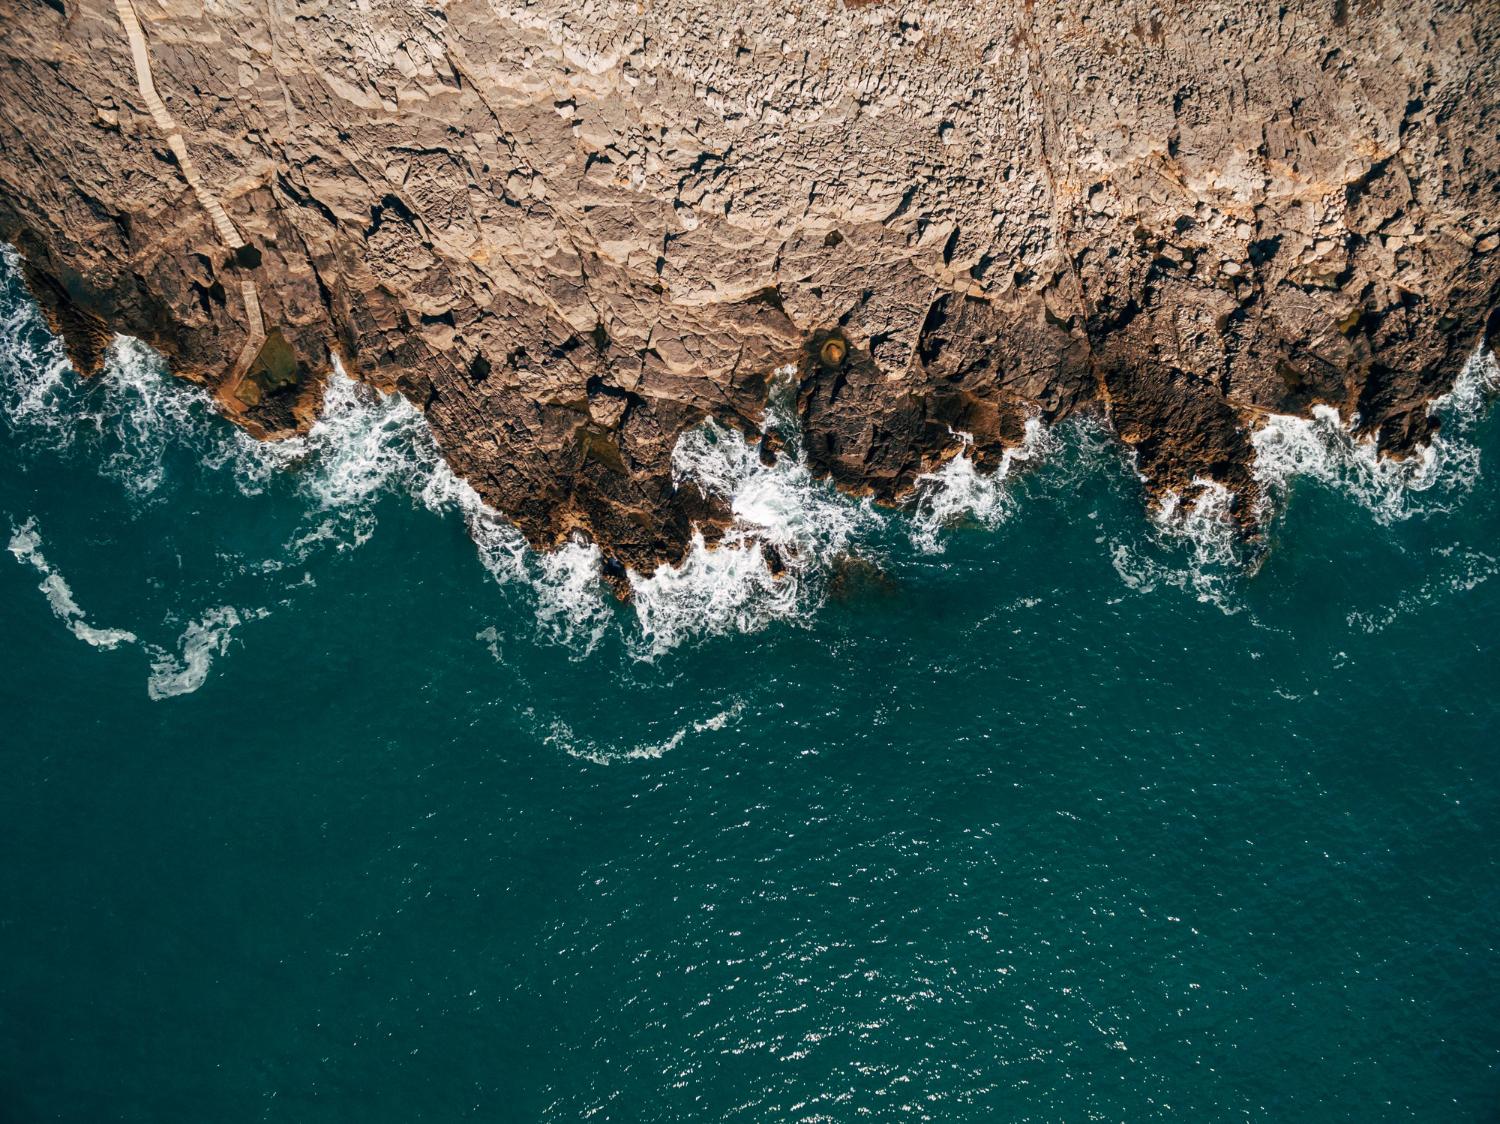
The mechanism is easier to see than to state, and it comes down to what a ruler skips.
Imagine measuring an island with a straight stick 100 kilometres long. You lay it end to end around the coast. It bridges straight across every bay, every estuary, every inlet narrower than itself. Britain measured this way comes out at roughly 2,800 kilometres.
Now use a 50-kilometre stick. It fits into bays the longer one skipped over. The measured length rises to about 3,400 kilometres — 600 more, from nothing but a change in the tool.
Shrink the ruler to a kilometre and it follows the outline of headlands and small bays. Shrink it to a metre and it goes around individual rock outcrops. Shrink it further and it traces boulders, then pebbles, then grains of sand.
The crucial point is that new detail keeps appearing at every scale. A smooth curve, like a circle, behaves differently: measure it with progressively shorter straight lines and they hug the curve more closely, converging on the circumference. There is a value to converge on.
A coastline has no such value. It is rough and bumpy at every scale you look, so each refinement finds more length to add. As the ruler tends toward zero, the measured length tends toward infinity.
The Paper That Started Fractals
In 1967 the mathematician Benoit Mandelbrot picked up Richardson’s work and published a paper with a title that has become famous: “How Long Is the Coast of Britain? Statistical Self-Similarity and Fractional Dimension.”
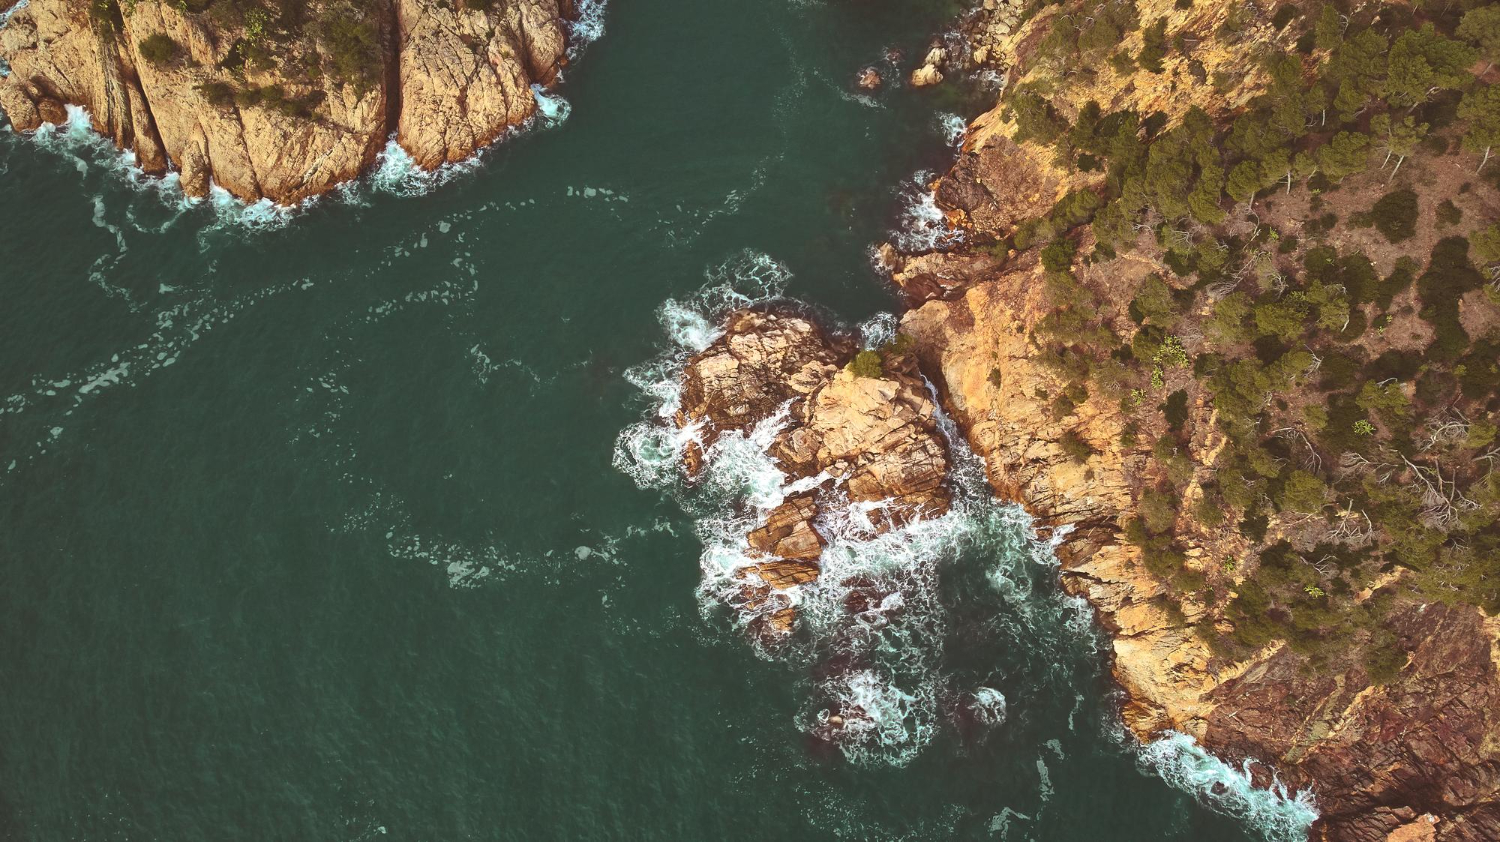
Mandelbrot’s insight was that coastlines are self-similar. Zoom in on a stretch of coast and the shape you see looks broadly like the shape you saw at the larger scale — a bay contains smaller bays, which contain smaller inlets. Not identical, as in a mathematical construction, but statistically similar.
Since the length cannot describe such a shape, Mandelbrot proposed measuring something else: how quickly the apparent length grows as the ruler shrinks. He called this the fractal dimension.
The idea is truly strange at first encounter. A straight line has dimension 1. A plane has dimension 2. Mandelbrot’s proposal was that a rough curve sits between them, with a dimension that is not a whole number.
A coastline’s fractal dimension falls between 1 and 2. A value near 1 means a smooth coast. A higher value means a twistier one that fills more of the plane without ever becoming a plane. The west coast of Britain has been estimated at roughly 1.25.
That number is doing the job length cannot. It does not tell you how far it is around Britain, because that is unanswerable. It tells you how rough Britain’s coastline is, which is a real and stable property.
Mandelbrot went on to develop fractal geometry as a full field, and the same mathematics now describes clouds, mountain ranges, river networks, trees and seashells — natural forms that share this property of detail repeating across scales.
What This Means for Every Coastline Figure You See
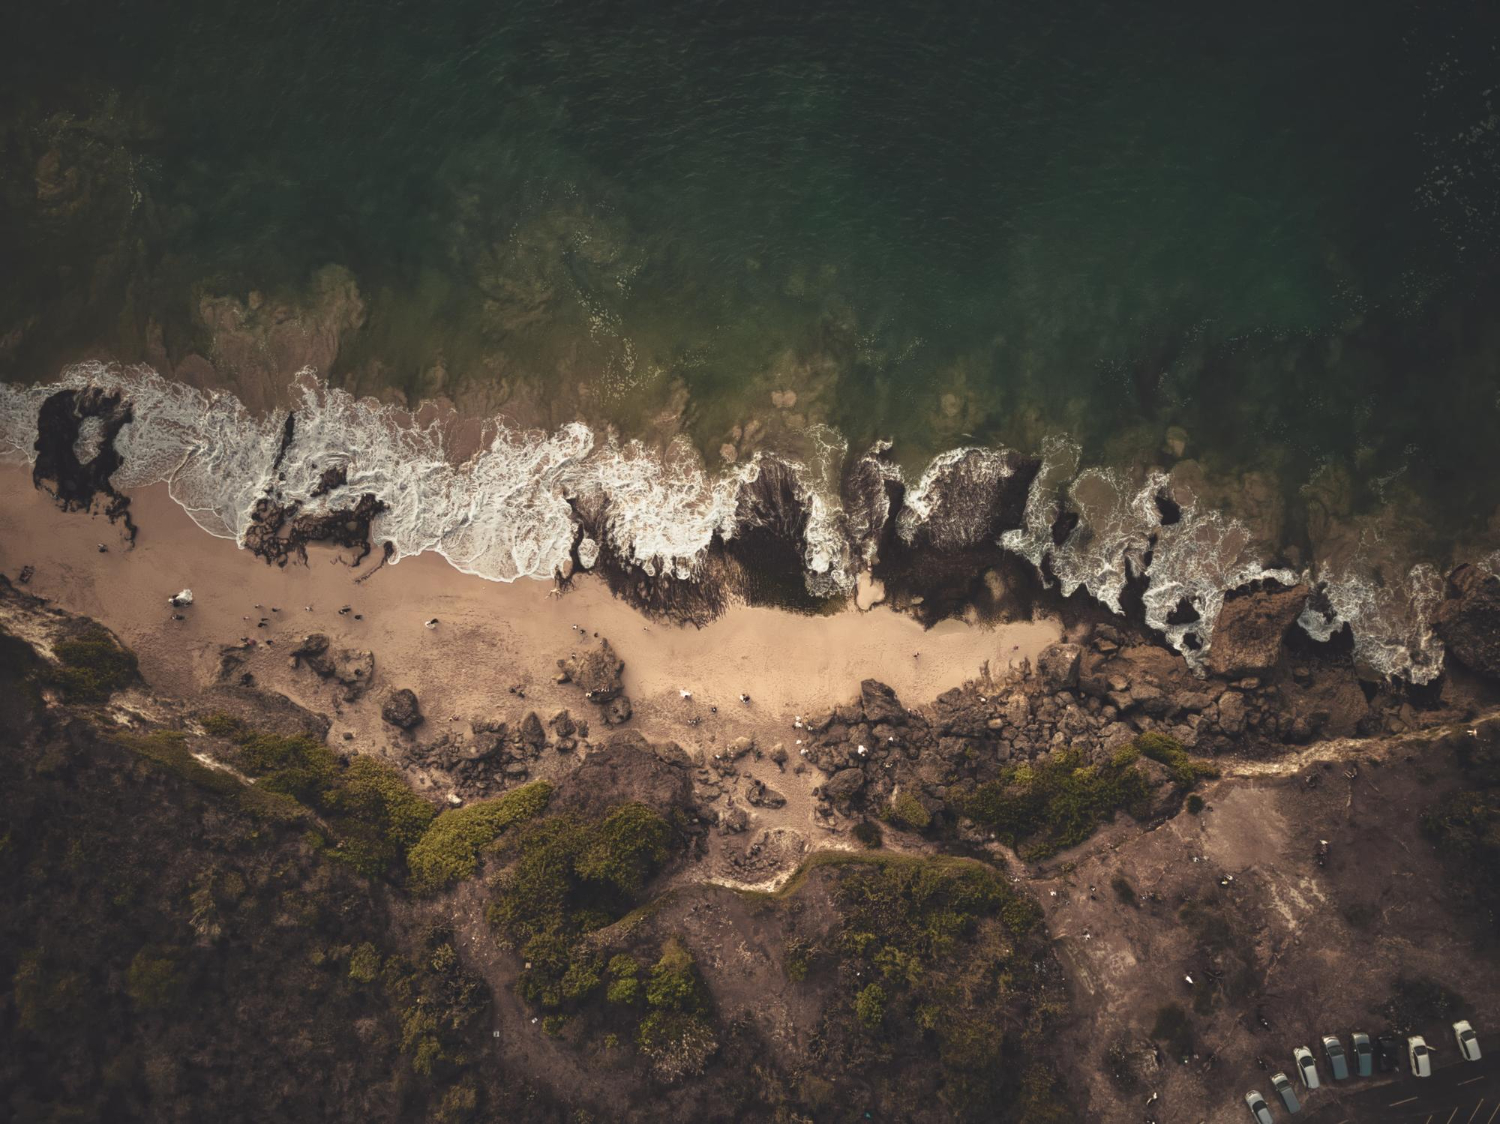
There is a practical consequence, and once you notice it you cannot stop noticing it.
Every published coastline length is the output of a choice about resolution. When a source states a country’s coastline as a specific number of kilometres, that number is a function of the map scale or data resolution used, not a property of the coast.
This is why different official sources give different figures for the same country, sometimes by very large margins, without anyone being wrong. They used different scales.
The effect extends to areas as well, though less severely. The measured area of an island also depends on resolution, but area converges toward a true value as resolution improves, whereas length does not. That asymmetry is worth knowing: you can meaningfully state a country’s area; you cannot meaningfully state its coastline length without stating the scale.
Richardson’s original border discrepancy is the clean example. Spain and Portugal shared one border and reported two lengths, and both figures were defensible.
Where the Idealisation Breaks
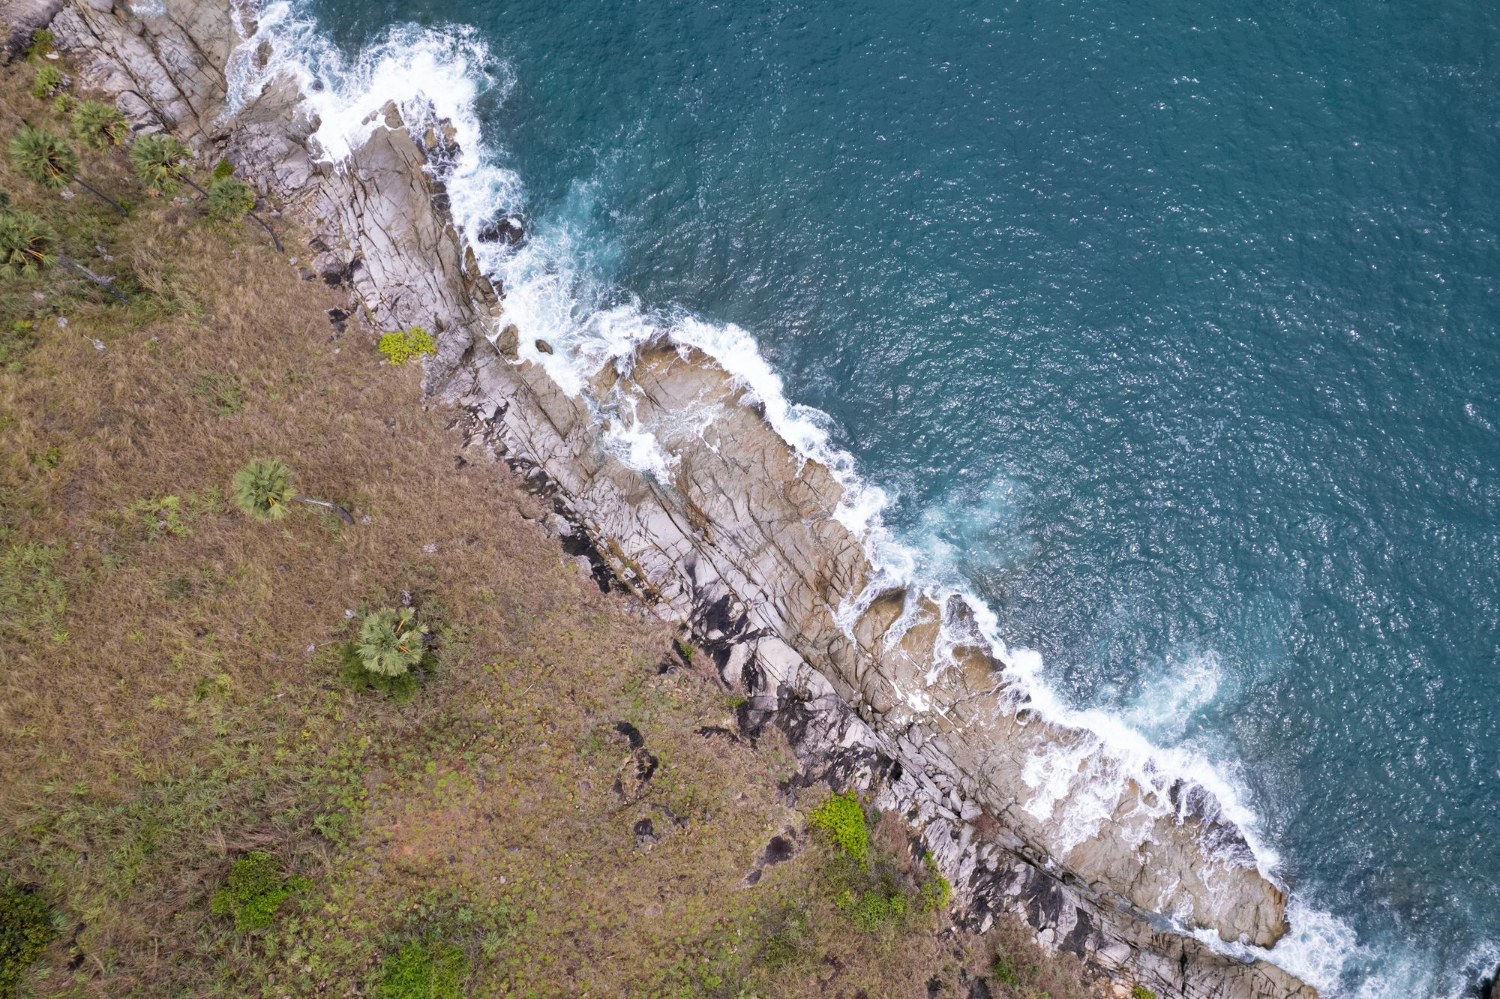
Honesty requires noting the limits, and Mandelbrot was careful about them himself.
Real coastlines are not true mathematical fractals. Idealised fractals like the Koch snowflake are constructed by repeating a rule infinitely, and are exactly self-similar at every scale. Coastlines are formed by erosion, deposition, tectonics and sea level, producing patterns that are statistically similar over a range of scales rather than perfectly self-similar forever.
That range has ends. Below the scale of individual sand grains and molecules, the fractal description stops applying, so the mathematical infinity is a property of the model rather than of the actual beach.
The relationship also only holds within a scaling range. Plotting ruler length against measured length on logarithmic axes gives a straight line — the Richardson plot — but only across the scales where the pattern holds.
Mandelbrot did not claim that any coastline actually has a fractional dimension in a literal physical sense. He showed that Richardson’s data behaved as though it did, and that treating it this way was enormously productive.
There is also the awkward question of what counts as the coastline at all. Tides move it twice a day, and where a river becomes an estuary and an estuary becomes a coast is a matter of convention.
Where Else the Problem Shows Up
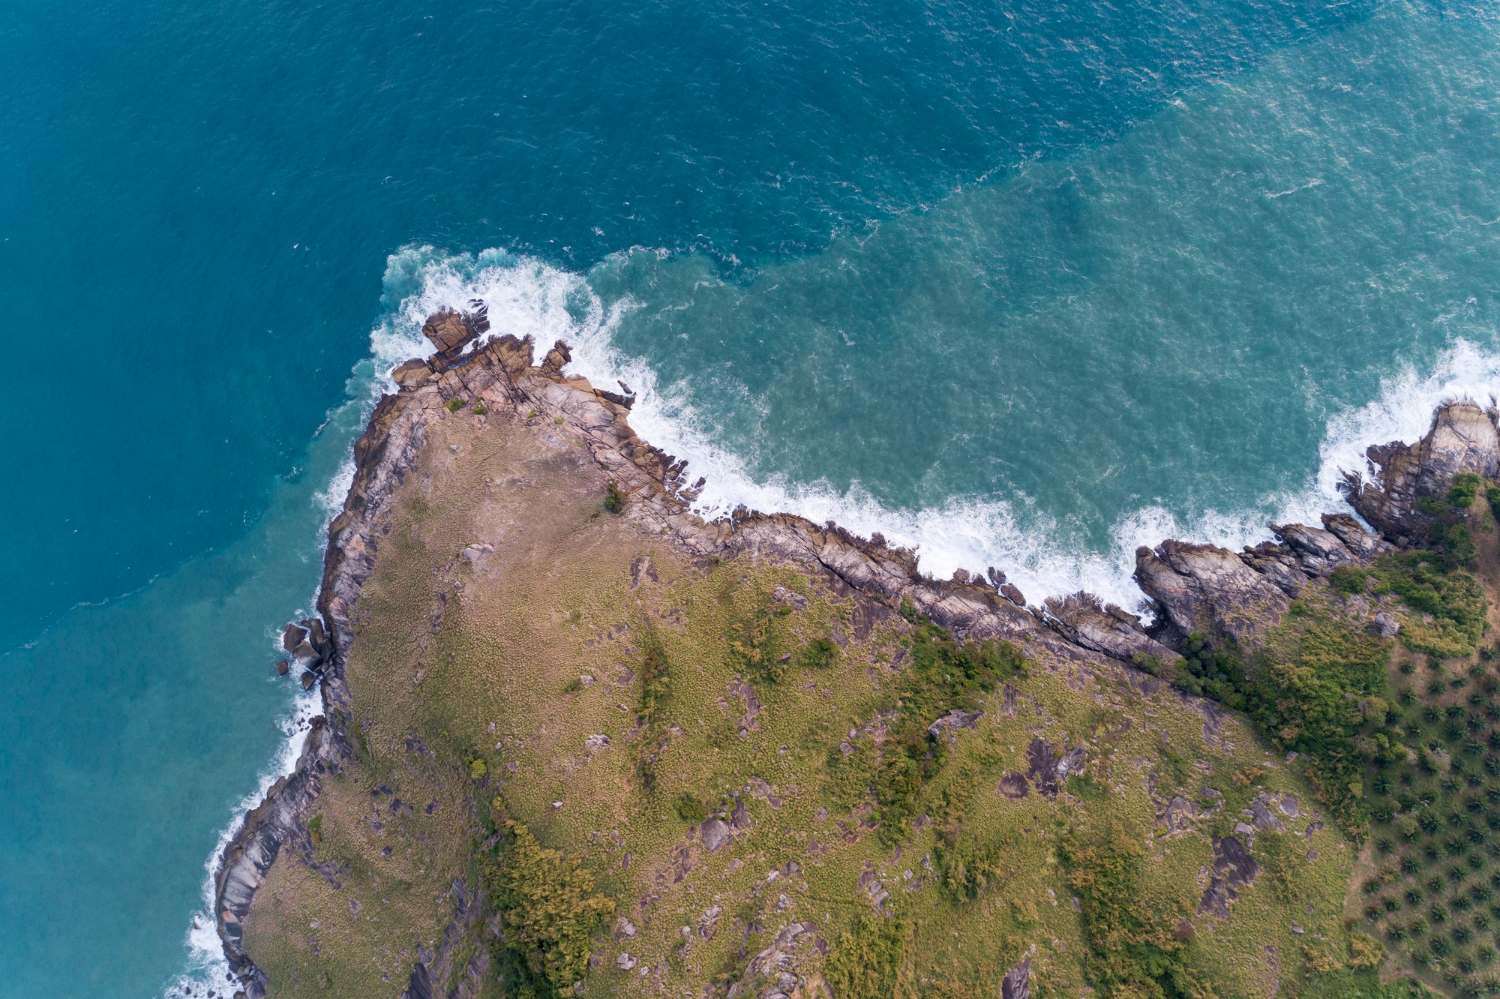
Coastlines are the famous case, but the same structure appears in a range of measurements people treat as settled.
River length is the clearest parallel. The reported lengths of the world’s longest rivers vary between sources, partly because of real disputes about which tributary counts as the source, and partly because a meandering river measured at finer resolution gets longer in exactly the way a coastline does.
Borders behave the same way, which is where Richardson started. Any land boundary that follows a natural feature — a river, a mountain ridge, a coast — inherits the problem.
The surface area of the human lung, the length of a blood vessel network, and the extent of a river delta all involve structures whose measured size depends on the resolution used, for the same underlying reason: detail recurs as you look closer.
Fractal geometry is now used to describe all of these, along with cloud edges, mountain profiles and the branching of trees. The insight that started with a border dispute between Spain and Portugal turned out to describe a substantial portion of how nature is shaped.
A Question That Improved by Failing
The satisfying thing about the coastline paradox is what happened when the original question turned out to be unanswerable.
Richardson wanted border lengths to test a theory about war. He found the lengths were not well defined, which was an obstacle rather than a discovery as far as his own project went.
Mandelbrot recognised that the obstacle was the interesting part. Rather than trying harder to measure something unmeasurable, he changed the question from how long to how rough, and the new question had a good answer that generalised across enormous areas of nature.
That is a pattern worth carrying around. Some questions resist answering because we lack data or instruments. Others resist because the question itself contains a false assumption — in this case, that a coastline is the kind of thing that has a length.
So the next time you see a confident figure for how many miles of coastline a country has, you can treat it correctly: as a measurement of the map, not of the coast.
Like our content? Follow us for more.